Introduction
This blog is part 2 in the series “Getting Started with IoT and Hardware Hacking.” In part 1, we covered some core fundamentals and how to build an affordable toolkit of IoT and hardware hacking gear. If you missed that post, make sure to check it out.
In part 2, we’ll start by setting up our Raspberry Pi as a test device with the “Dumb Thing” firmware. This custom firmware is coded with common vulnerabilities that we’ll use in this series to learn about IoT hacking. After setting up the Raspberry Pi, we’ll then learn all about UART, including how to identify it, how it works, and how we can use it to view IoT devices logging and even get a shell!
For the examples in this walkthrough, we will use a Raspberry Pi. However, the end goal is that you can transfer this knowledge to actual commercial devices. With that in mind, you will most likely be able to follow these steps with slight modifications for many cheap, off-the-shelf IoT devices.
Setting up the Raspberry Pi
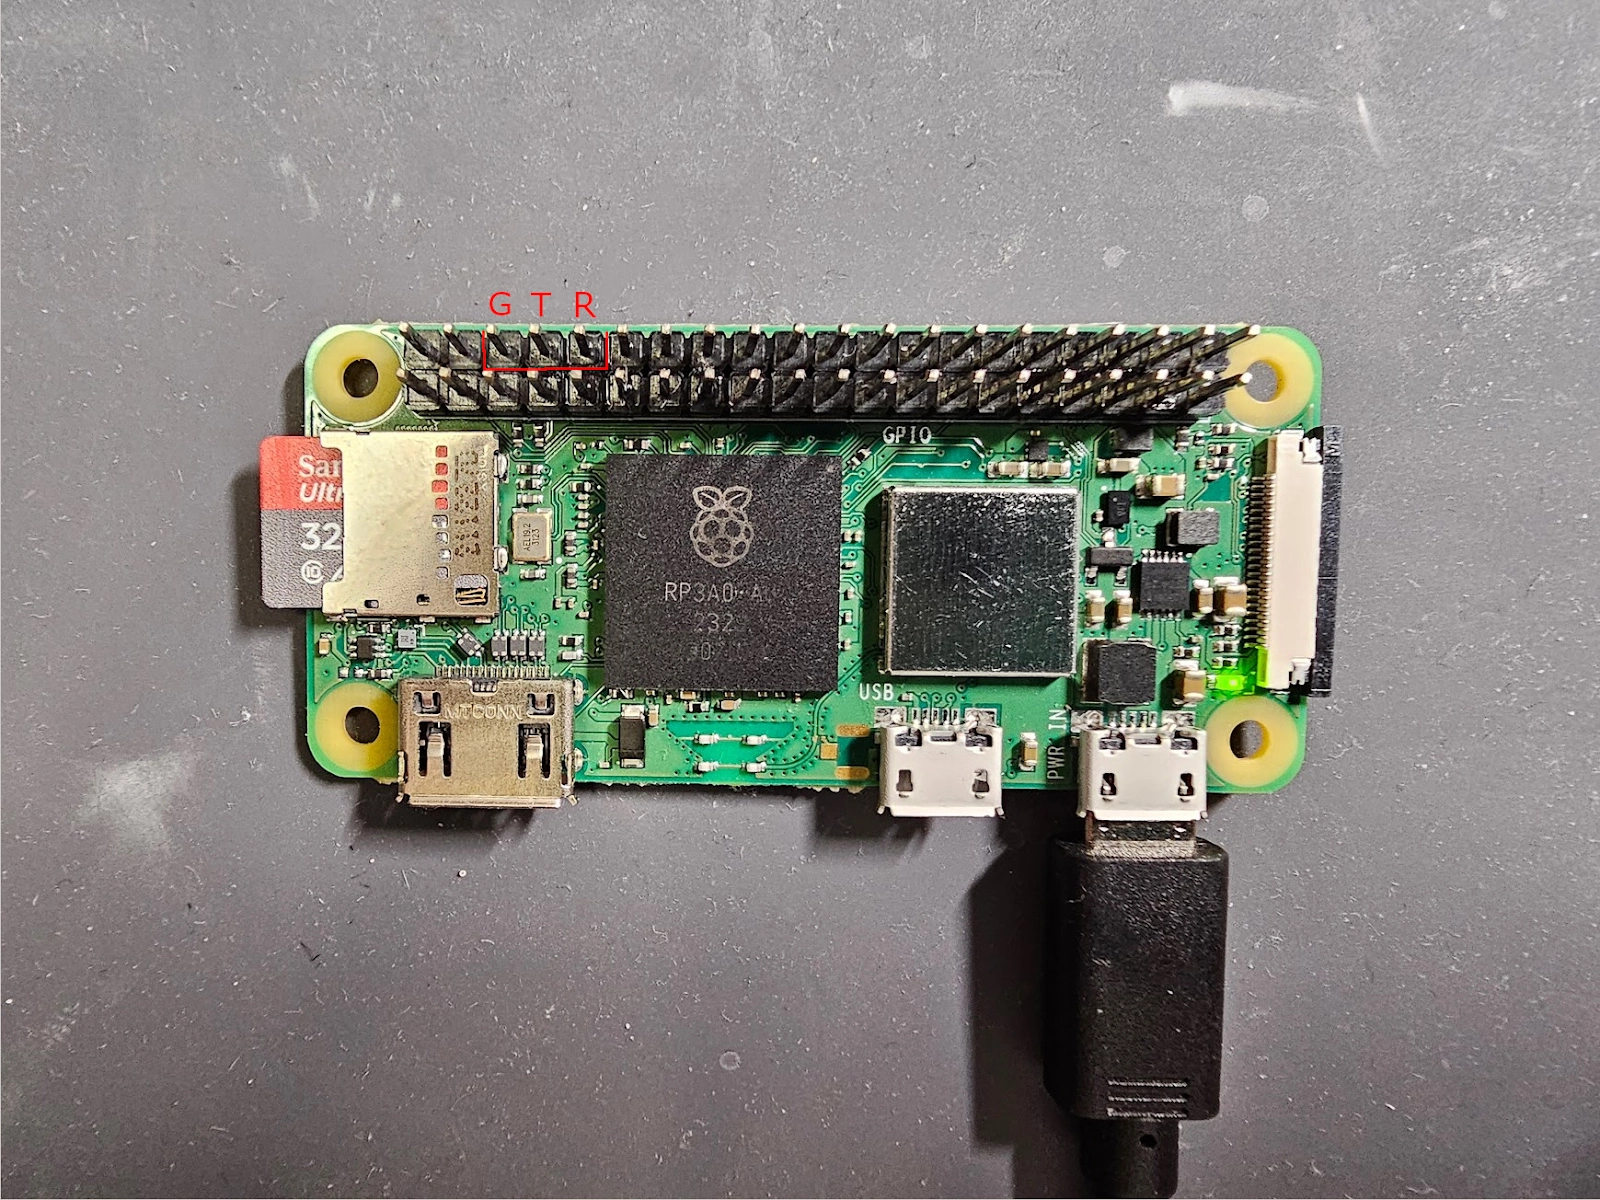
The first step is to set up our Raspberry Pi with the custom firmware. We’ll be using a Raspberry Pi Zero 2W (because it’s the most affordable one). If you purchased a Raspberry Pi without the header pins attached, then you’ll need to attach those, as they give access to the General Purpose Input/Output (GPIO) pins which include the UART connections.
If you’re not comfortable with soldering, there are some solderless options available, like this set of GPIO hammer pins: https://www.adafruit.com/product/3413
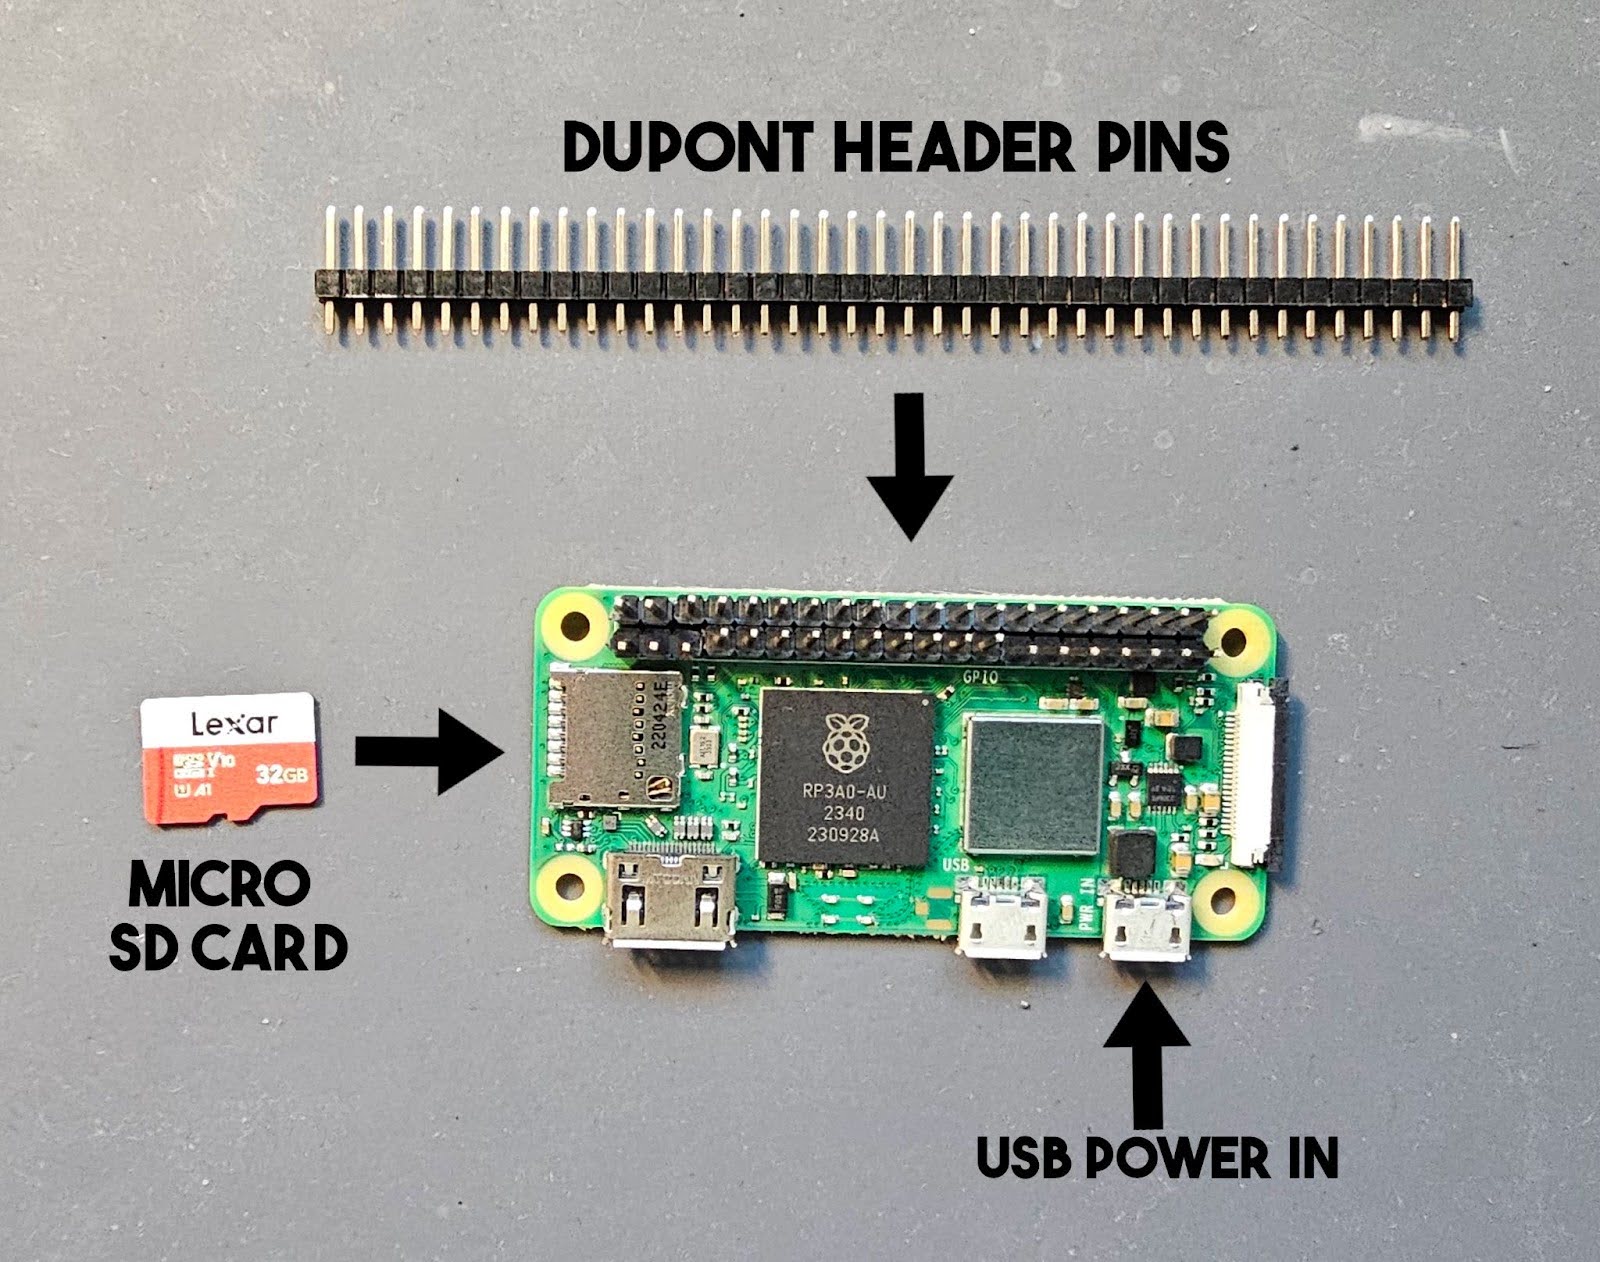
All of the following steps assume you are using a Linux host, more specifically an up-to-date version of Kali Linux. You definitely don’t need to use Kali for IoT hacking, However, it does come with most of the required tools installed. For your convenience, I’ve included the commands you can run in your terminal as code blocks for each step.
Setting up the Firmware
Next, we will need to write the “Dumb Thing” firmware to a Micro SD card so it can be loaded into the Raspberry Pi. For that you will need a Micro SD Card and a card reader so you can plug it into your computer.
You can download the firmware from github here: https://github.com/digitalandrew/dumb_thing/releases/tag/v1.0.1
You’ll need the dumb_thing_v_x_x_x.zip file (where xs represent the version number, currently 1_0_1) which contains the firmware image. You can also grab it with wget:
wget
https://github.com/digitalandrew/dumb_thing/releases/download/v1.0.1/dumb_thing_v_1_0_1.zip
The firmware is zipped, so you’ll need to unzip it:
unzip dumb_thing_v_1_0_1.zipAfter unzipping it, you should have a .img file, which we will write to the SD card. I suggest using Balena Etcher to write the firmware image as it is the easiest method. You can download it from here: https://github.com/balena-io/etcher/releases/download/v1.19.21/balenaEtcher-linux-x64-1.19.21.zip
wget
https://github.com/balena-io/etcher/releases/download/v1.19.21/balenaEtcher-linux-x64-1.19.21.zip
Again, we’ll need to unzip the downloaded file:
unzip balenaEtcher-linux-x64-1.19.21.zipNow we can launch the application:
cd balenaEtcher-linux-x64
./balena-etcher
After launching, you will arrive at the main screen which looks like the below image.
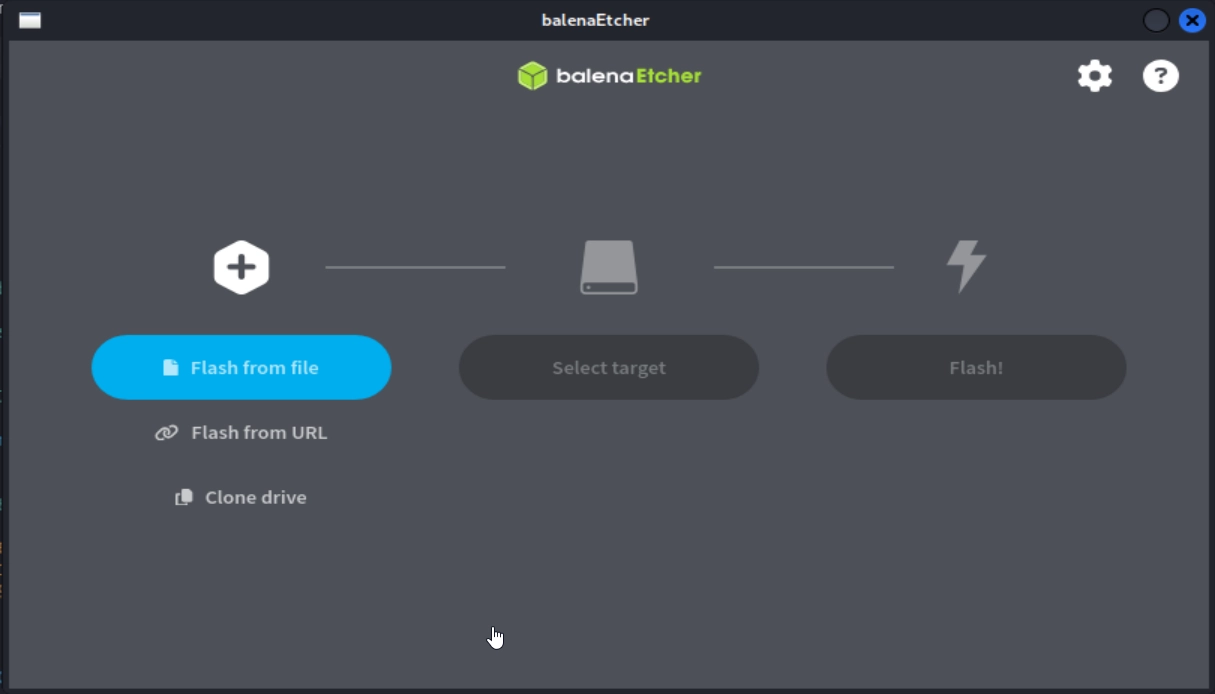
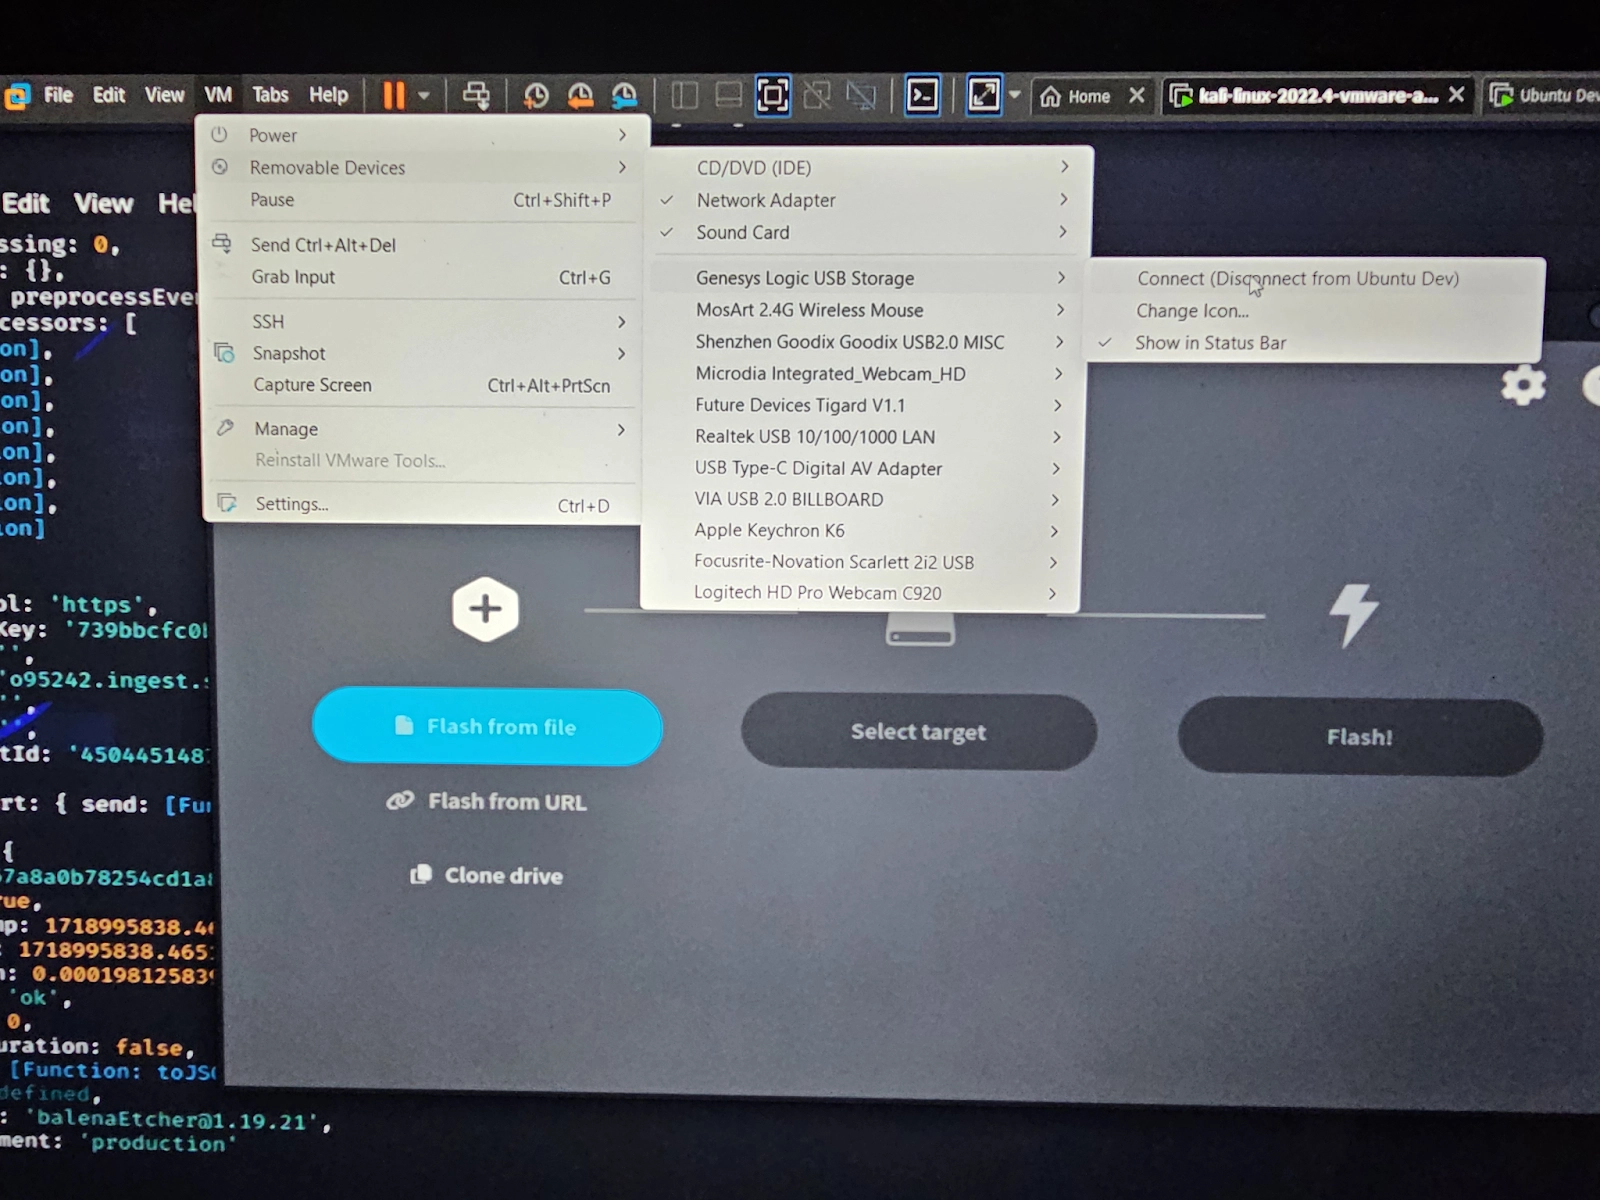
If you haven’t done so already, you’ll need to plug your Micro SD card into the card reader and your card reader into your computer. If you are running Kali as a VM, you may need to connect it from the removable devices menu. The steps for this differ on your hypervisor, but are all similar. An example for VMWare Workstation is shown in the image below.
In Etcher, select “Flash from file” and choose the unzipped firmware .img file that was previously downloaded and unzipped.
Next, choose “Select target” and choose the SD card that you plugged into your computer. The location will most likely be /dev/sdb. Make sure to take a note of the size and ensure it roughly matches that of your SD card. This operation will completely format and erase what is selected here, so you’ll want to double check and make sure it is the drive you’re intending.
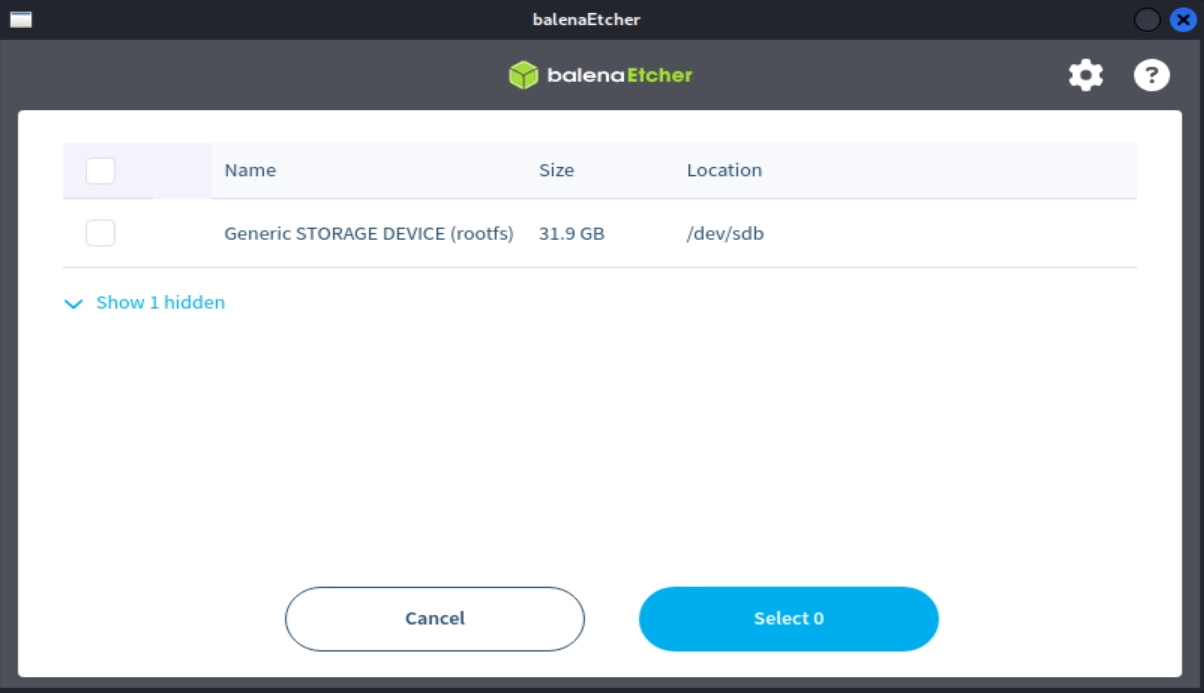
WARNING: If your SD card isn’t showing up here, don’t look for it under the “Show hidden” section. This contains drives for your VM/computer. Writing to any of these will most likely damage your VM/Computer.
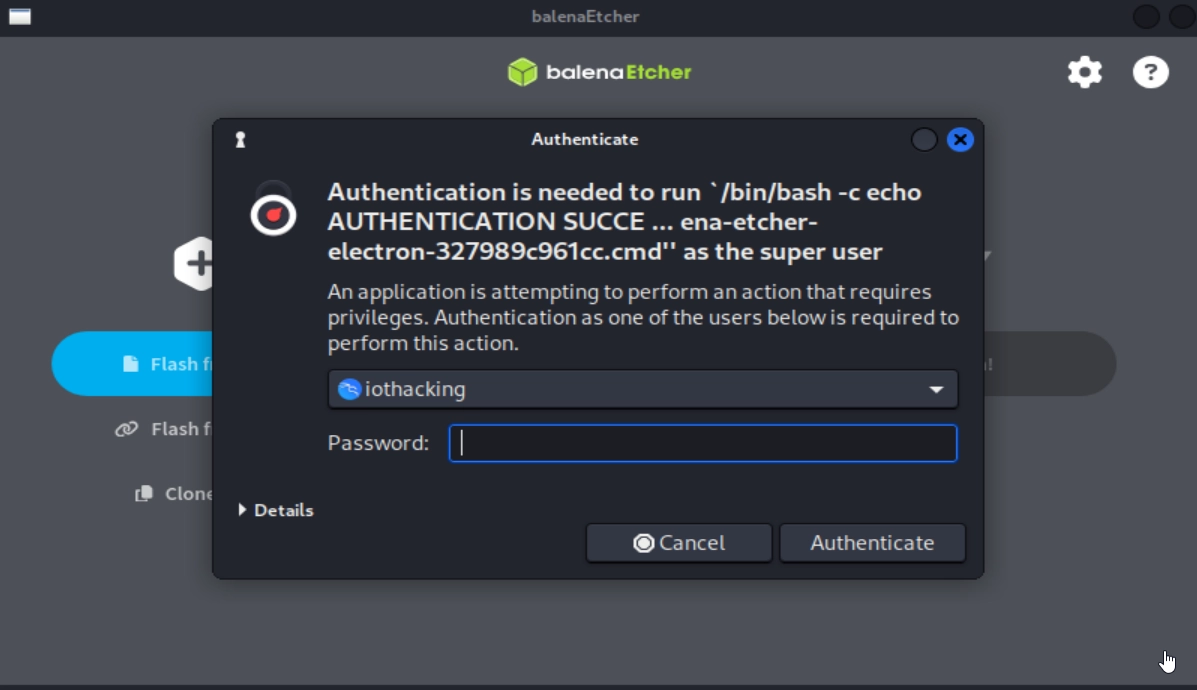
Once you’ve selected the img file and the SD card you want to write to, you can click “Flash!.” Depending on how you ran the Etcher application, you may need to provide your password. You will need sudo permissions on your account for it to flash the drive.
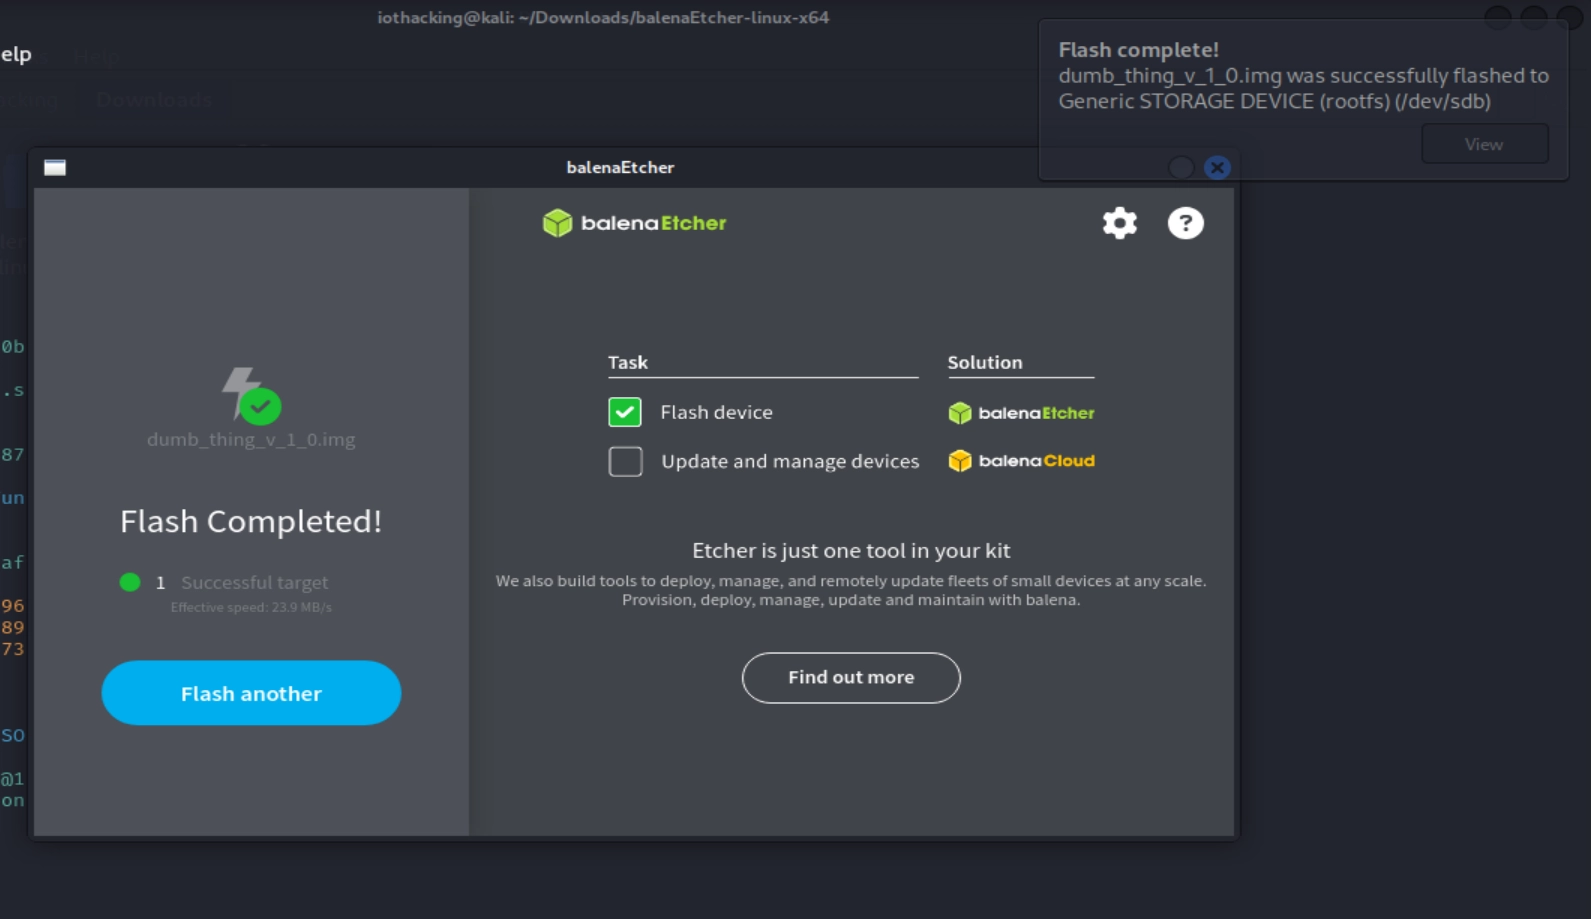
It might take a few minutes to flash and validate. If it fails (this happens sometimes) I’d suggest trying again. Sometimes it takes 2-3 times for it to work properly. If it keeps failing, try unplugging and plugging back in your card reader and/or SD card. Once it succeeds, you’ll see a message like the below image.
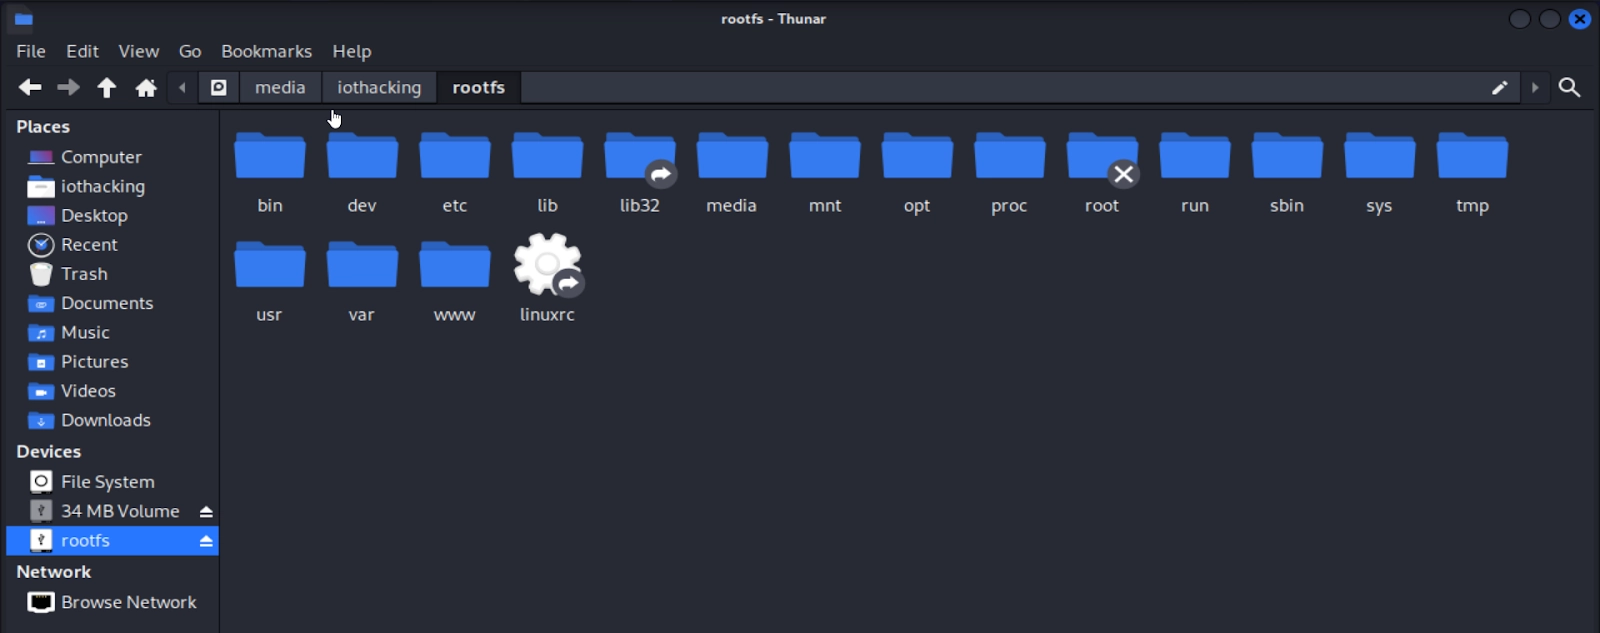
Before you remove your SD card, the best practice is to eject the drive. The easiest way to do this is to open your file browser and alongside the “rootfs” device and click the eject button.
Once ejected, you can remove your SD card from the computer and insert it into your Raspberry Pi. After insertion, you can power on the Pi. The easiest way to power it is to plug a Micro USB cable into the furthest right micro USB cable connector labeled “PWR_IN.” If you’re not sure where to plug the SD card or USB cable, check out the first picture in this section (Setting Up The Raspberry Pi) that shows the location of the SD card and Micro USB port. At this point, you should see the green LED in the bottom-right corner of the Pi blink a few times and then turn a solid green. Congratulations, you’ve now set up your Raspberry Pi with the Dumb Thing Firmware.
All About UART
Now that we have our device setup, we can use it to learn about the first and in my opinion most important protocol you need to understand for IoT hacking – UART. UART stands for universal asynchronous receiver transmitter. It’s an old and very basic format of serial communication. It’s widely used in embedded systems such as IoT devices for displaying logging information and in many cases accepting inputs like commands. Later on in this section we will interact with the UART on the Raspberry Pi to get a shell.
How UART Works
UART works by sending pulses of voltages that represent binary. To send a “1” the voltage is set to the high level (usually 3.3V or 5V) and to send a “0” the voltage is set to, you guessed it, 0V.

The asynchronous part of the name means that there is no shared clock to synchronize the communication. Instead, a predetermined transmission speed called the Baud rate is used to tell the receiver how to decode the signal. The Baud rate indicates how many symbols (which in most cases are just bits) are transmitted per second. From the Baud rate, you can determine the symbol duration (Ts) which is sometimes called the pulse width. This allows the receiver to decode the signal, particularly when there are two or more of the same symbol transmitted back to back.
The receiver transmitter part of the name indicates that there are two communication lines used for each device. One to transmit on and one to receive on, the transmit line is usually referred to as Tx and the receiver Rx. This aids with the simplicity of the design as there is no requirement to share a line and avoid collisions. Instead, each device is free to talk on its Tx line, which in turn is connected to the other devices Rx line. There is no guarantee that all devices will listen on their Rx, some devices only transmit.
We will cover some additional UART properties later on once we get a capture with the logic analyzer and look at some actual UART traffic.
Identifying UART Connections
In our example, we are using a Raspberry Pi which has easy-to-find, readily available schematics that clearly outline the UART pins. Unfortunately, for most commercial devices this won’t always be the case. With this in mind, we’ll walk through some of the steps to identify UART connections, even though it seems trivial on a device like the Pi where it’s easy to find them.
At a minimum for duplex communication (both devices transmitting and receiving), UART requires three pins, the aforementioned Tx and Rx, and a common ground. Sometimes a Vcc pin will be included with UART. Vcc stands for Voltage Common Collector and essentially means the operating voltage (usually 3.3V or 5V). The Vcc pin can supply power to external devices that may not have their own power supply or in some cases be used for a pull-up resistor. With that being said, in the majority of cases it won’t be used or present.
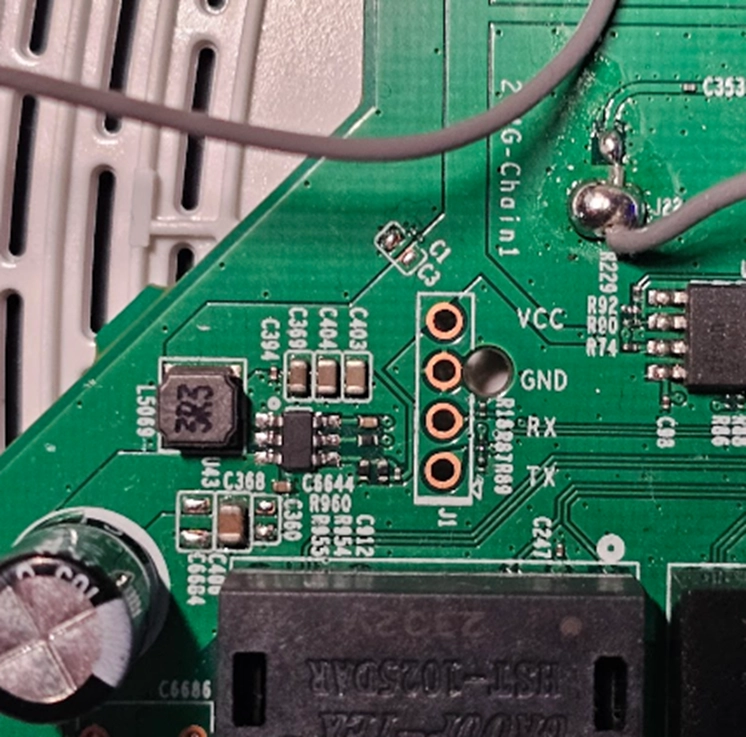
We can use this knowledge to visually identify areas of interest that may be a UART connection. Usually, we look for three or four connections in close proximity to each other. In some cases, I have seen only Rx and Tx together and a more general common ground located elsewhere on the board. Depending on the size and layout of the circuit board, the connections could be a through hole connector (pictured below).
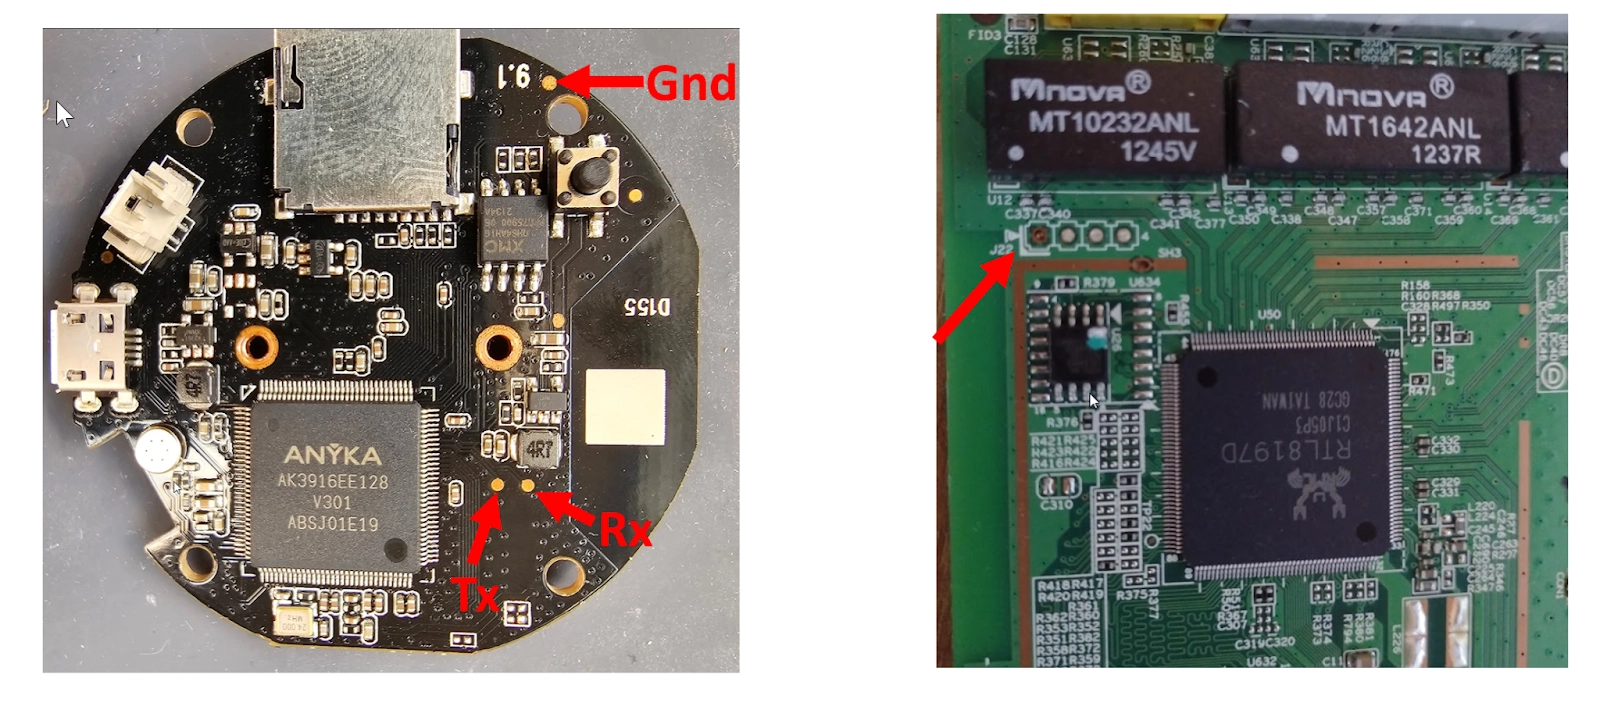
On some circuit boards, especially those with smaller layouts, the connections could be surface mount test pads (pictured below).
If you’ve identified a set of connections that you think might be UART (or some other debug interface), an easy way to check is to use a multimeter and look for fluctuating voltage levels shortly after the device is powered on. The reason for this is that devices are usually very chatty with their logging on boot up. On most embedded devices that logging is sent out to the debug ports instead of being stored on the device. A fluctuating voltage signal is a strong sign that a transmission is occurring and we should investigate the connection and its surrounding ones more in-depth.
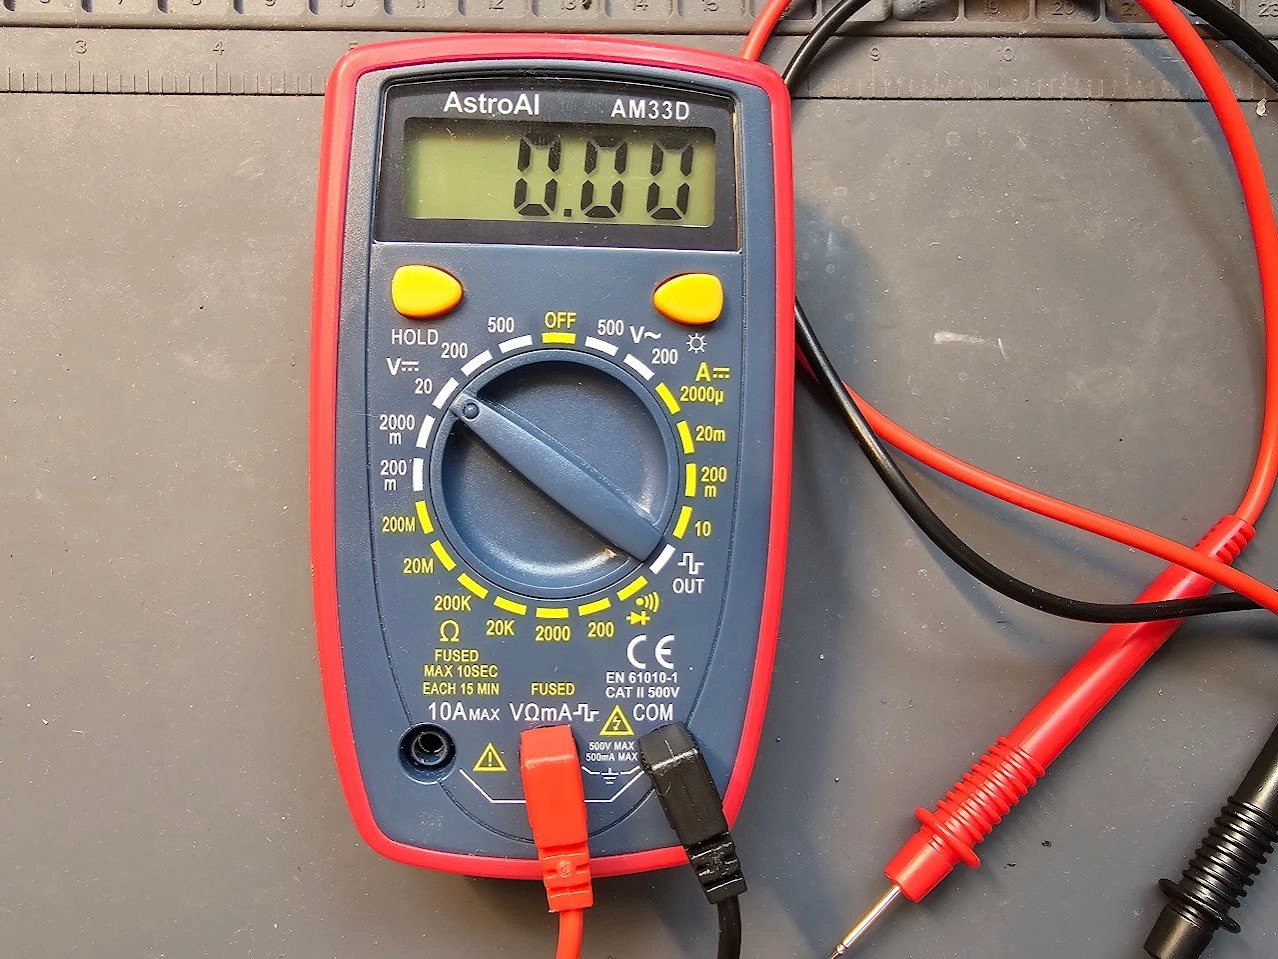
Let’s take a look at how to check this on our Raspberry Pi. Set your multimeter to measure volts DC (Vdc). If you don’t have auto-range capabilities on your multimeter, you’ll need to set the expected voltage range. For the Raspberry Pi, this is 3.3V. On my multimeter, this means setting it to the 20 Vdc setting, which will allow it to measure from 2 – 20 Vdc.
To take the measurement, we’ll probe from across the Tx pin of the Raspberry Pi and the ground pin. Press the red probe of the multimeter to the Tx pin and the black probe to the ground (GND) pin as shown in the picture below.
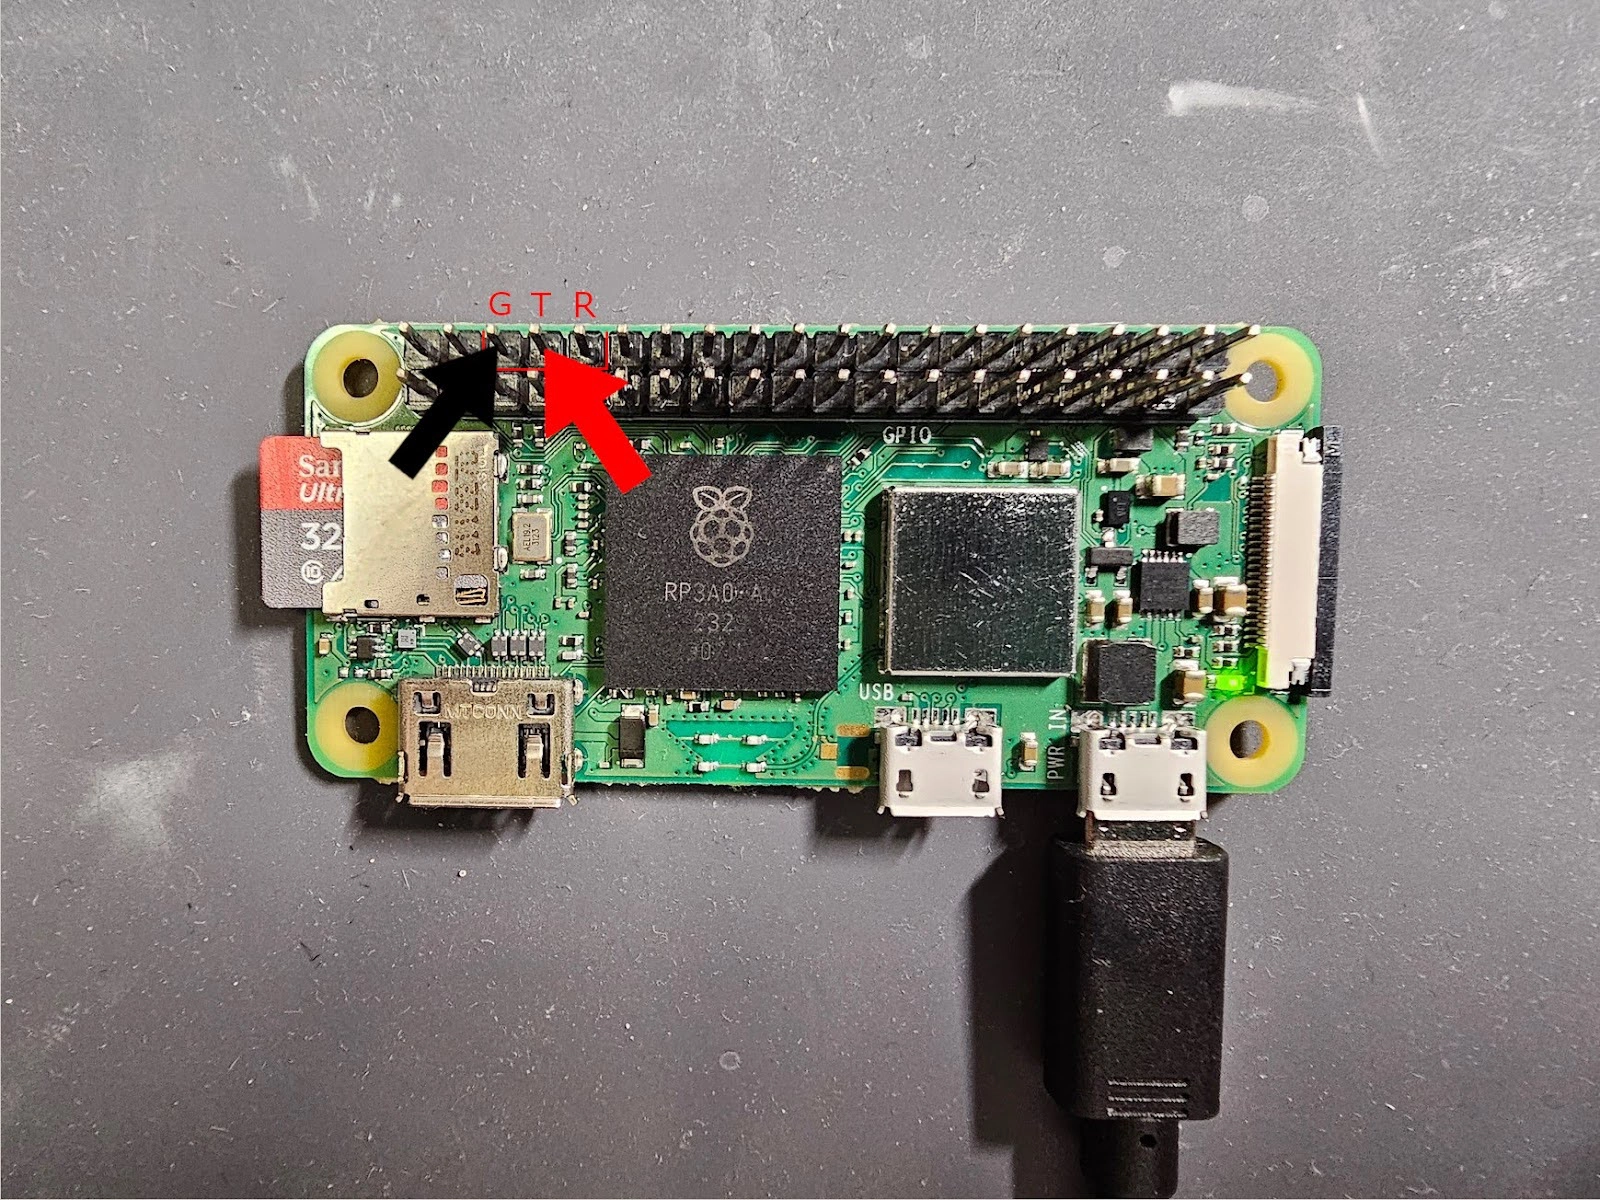
If your device is already powered on, you’ll most likely see a solid reading of 3.3V. This is because there is no transmission taking place. In UART when the line is idle, it’s held at the high voltage. If you power off the device and power it on while taking the measurement, you should see the voltage fluctuate between 1.8V to 3.3V. Note that on the Raspberry Pi, the first portion of the bootup doesn’t print out to UART, so you will have a few seconds to take the probes off, unplug, and replug the device and bring the probes back. The reason the voltage fluctuates but doesn’t actually go down to 0V, is because the transmission is happening too fast for our multimeter to fully pick up. Instead, the measurement is more of an average.

Analyzing UART Signals with a Logic Analyzer
Now that we’ve identified what we suspect to be a UART signal, we can further investigate it with a logic analyzer. Using this tool will allow us to see the actual digital pulses that were too fast for our multimeter to pick up. Keep in mind that in real world situations, the visual inspection and/or measuring with a multimeter might provide enough information to skip ahead to connecting a USB to UART adapter to the device. This is a valid approach, especially in our case where we already know where the UART connections are and the UART parameters. However, sometimes it’s not this easy. It’s possible that fluctuating voltage could be caused by an entirely different protocol. For this reason, I think it’s good to learn how to use a logic analyzer.
Let’s get started by hooking up our logic analyzer to the Raspberry Pi. Hook one of the supplied dupont wires from the ground pin on the logic analyzer (one of the two on the bottom row) to the ground pin on the Raspberry Pi (the black wire in the picture below). Hook another wire from the first channel pin on your logic analyzer (could be CH0 or CH1 depending on how yours is labeled) to the Tx pin on the Raspberry Pi (the white wire in the picture below).
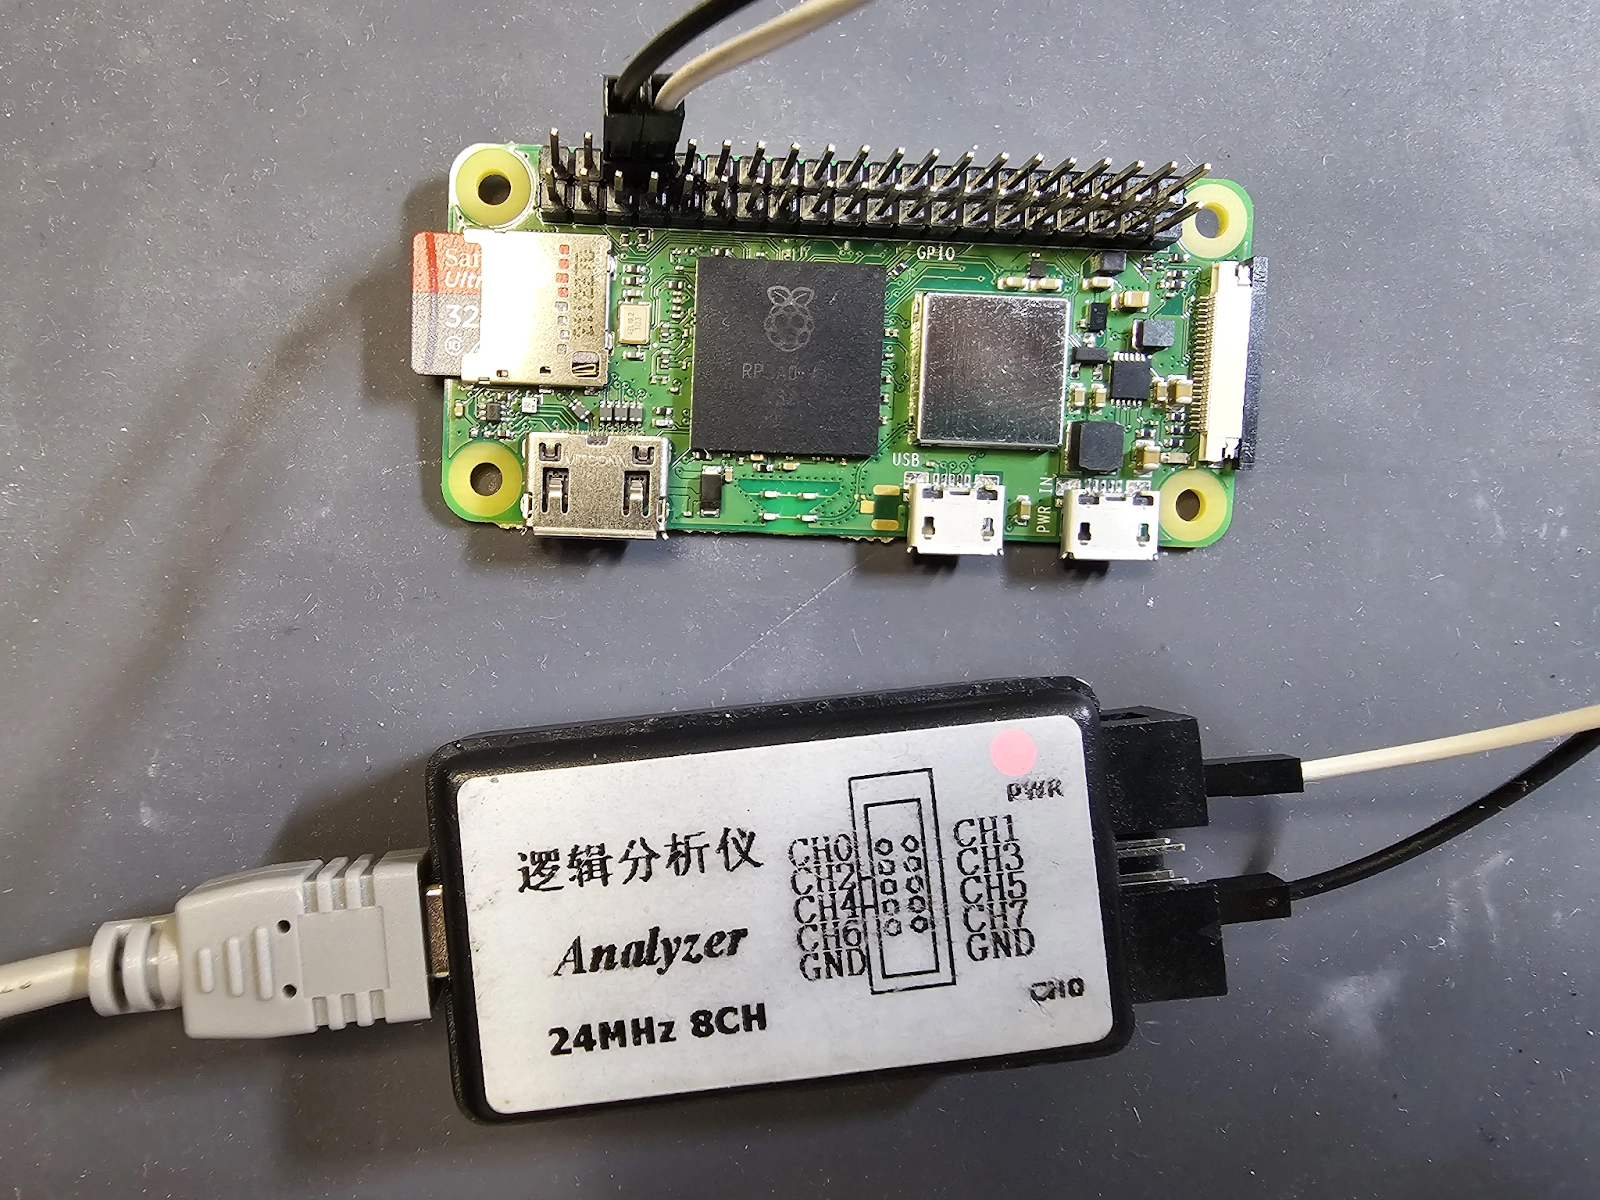
Next, we’ll need to install the Sigrok software that we’ll use to interact with the logic analyzer and visualize its captures. On Kali you can get it via the apt repository:
sudo apt-get -y install sigrok
sudo apt-get -y install sigrokIf you’re curious to learn more about the Sigrok project, you can check out their website here: https://sigrok.org/wiki/Main_Page
Now that we’ve got the software installed, you can plug your logic analyzer into your computer. Keep in mind that if you’re on a VM you may need to “connect” the device to the VM as we did before with the card reader. If you’re using the same one as me it will likely appear as a “LakeView USB Device.”
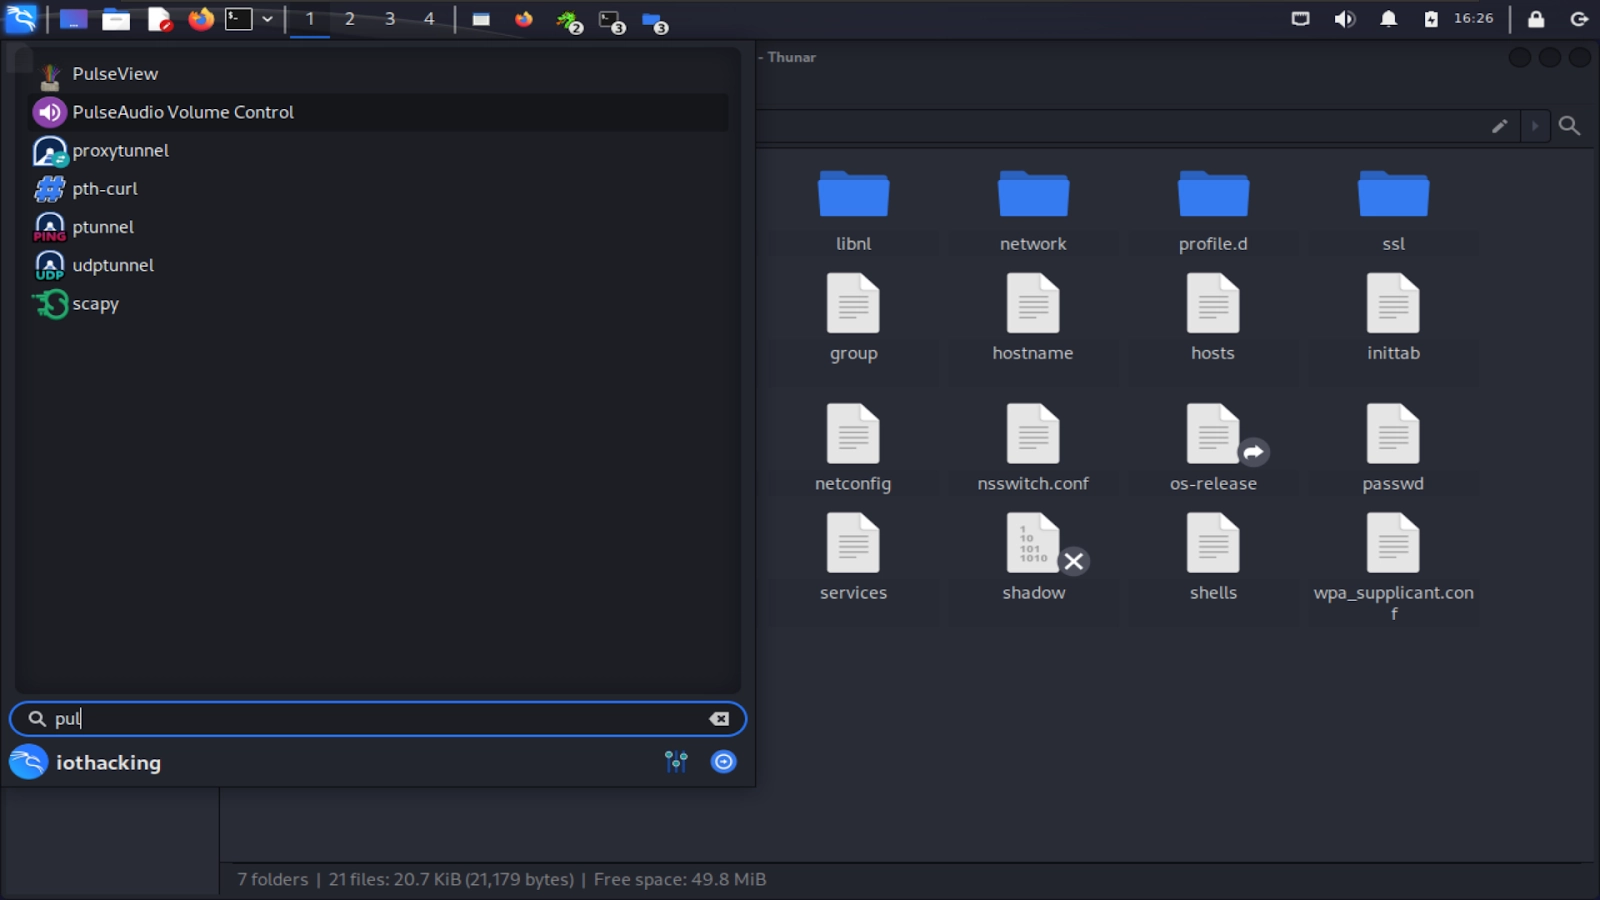
We’re now ready to launch the Sigrok Pulseview software. You can search for it in the applications menu and launch it through there.
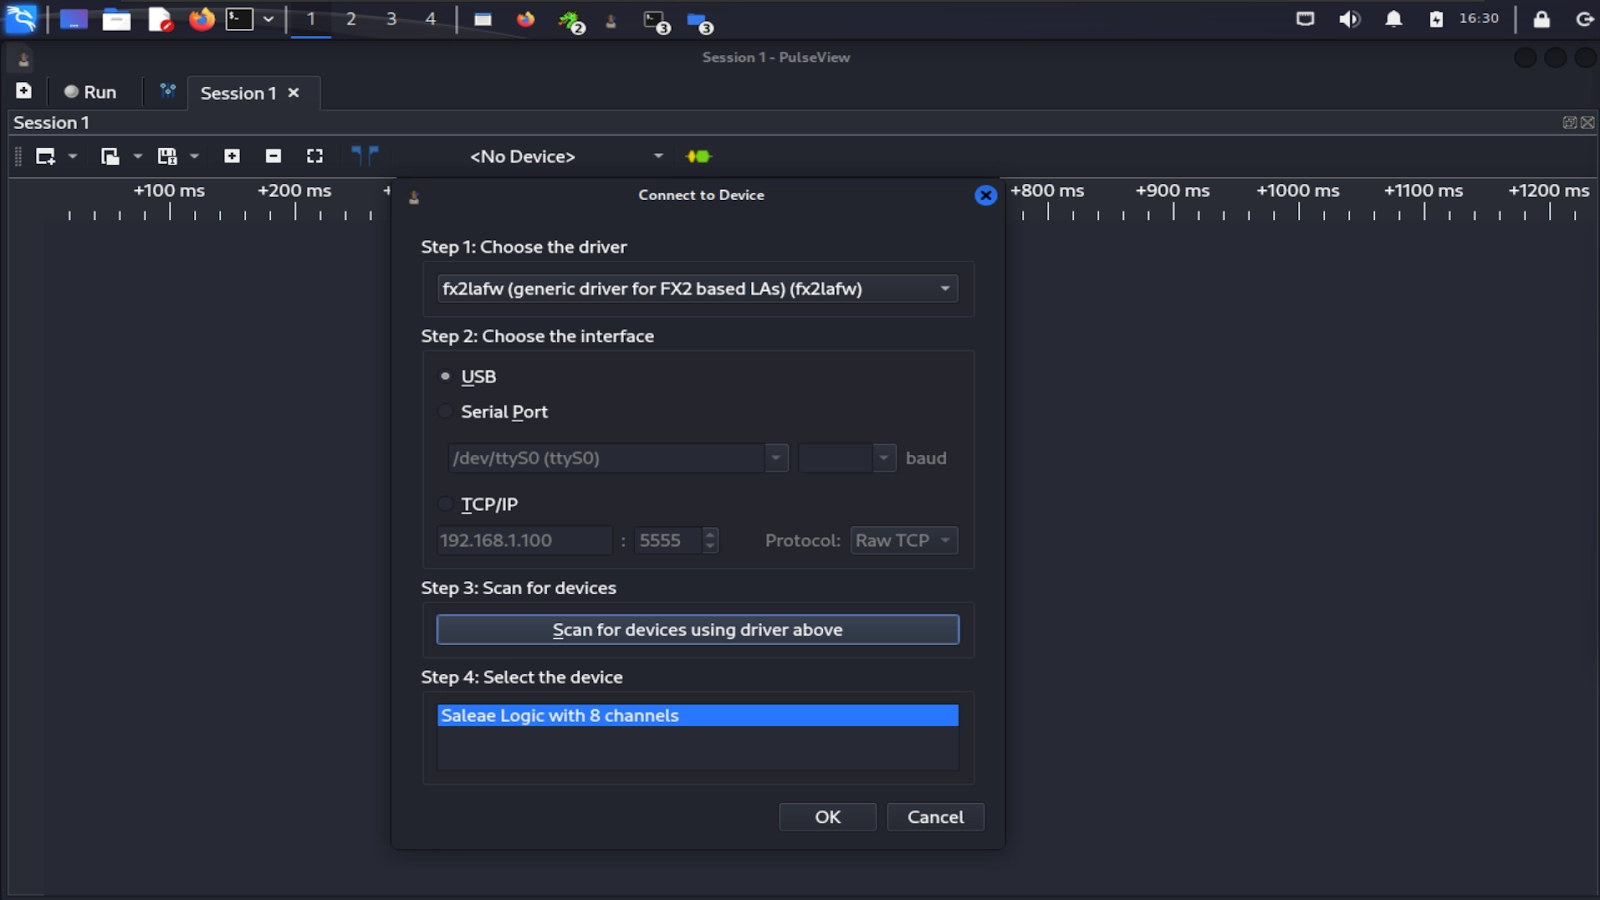
Before taking a capture, we’ll need to select our device and configure a few settings. First, select the “<No Device>” button, then from the pop up choose “fx2lafw” (generic driver for FX2 based LAs) as the driver and USB as the interface. Then click “Scan for devices using the driver above,” and your device should appear at the bottom as “Saleae Logic with 8 channels.” Select that and then click “OK.”
Your device should be visible where it previously said <No Device>. Now set the samples to 50 M and the frequency to 1 MHz. This is telling the software how many samples to take and at what frequency to sample at. For slower protocols like UART, 1 MHz is sufficient. However, keep in mind for other protocols you’ll probably need to increase the sample rate.
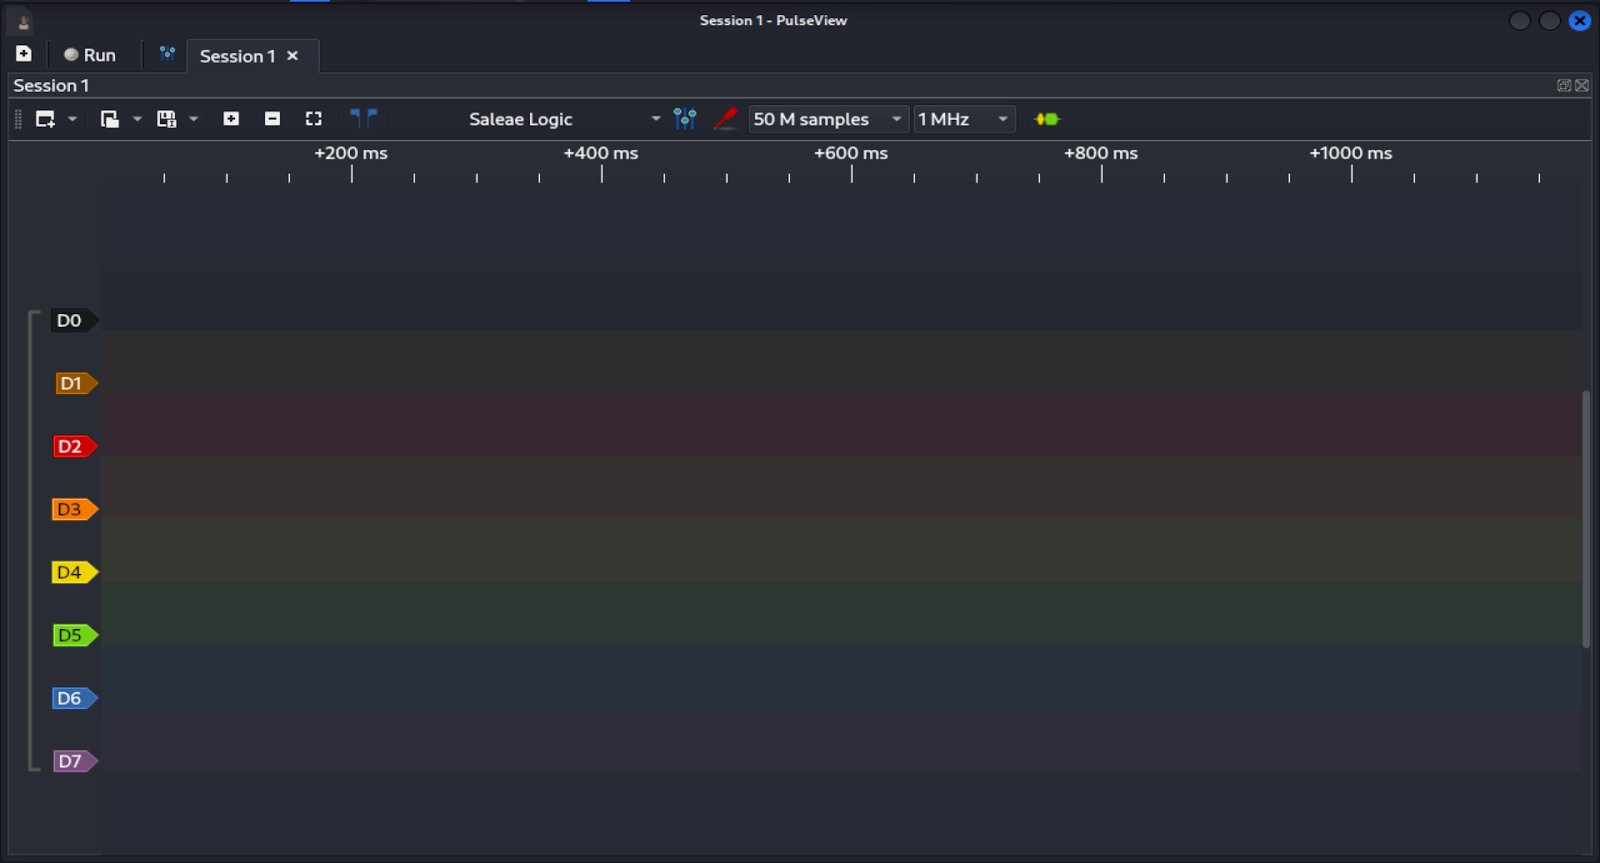
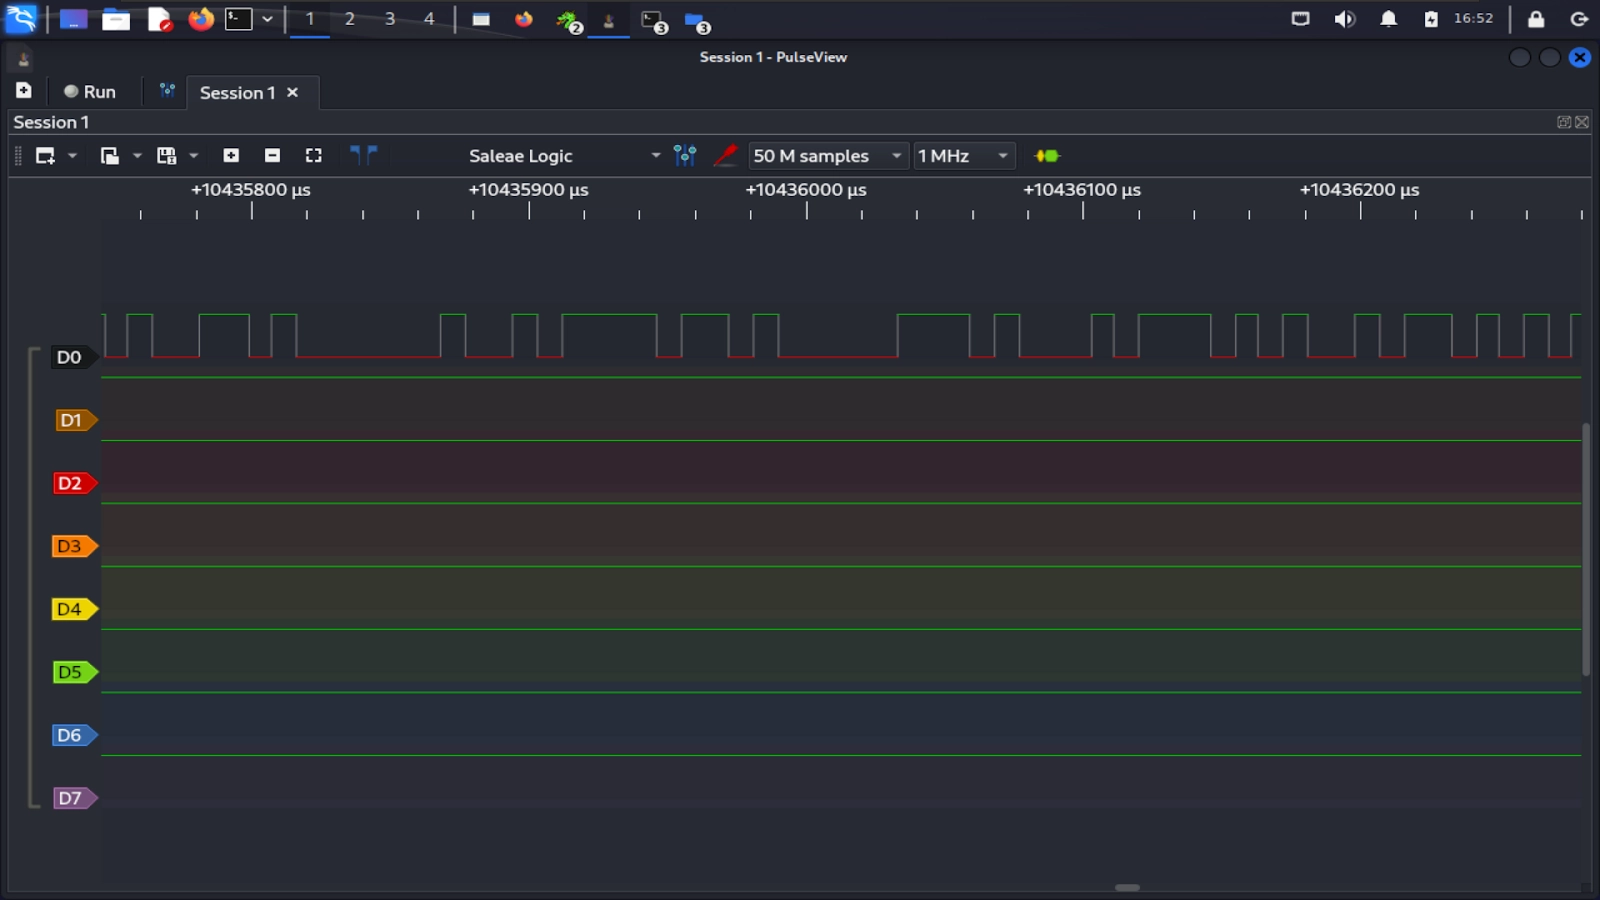
Now we’re ready to start a capture. For UART, most traffic will occur on device boot-up. First, hit the “Run” button in the top-left of the screen and then power on the device to start capturing the UART traffic. Note that our settings will let us capture 50 seconds of activity so there is not a huge rush. Power it on after you start your capture so you don’t miss any of the boot logs. Shortly after powering on, you should see UART traffic appear on D0 as square waves pulsing on and off. Once the UART traffic has slowed, you can stop the capture.

Zoom in on the captures using your scroll wheel or the plus and minus buttons to see the individual pulses which represent bits on the wire.
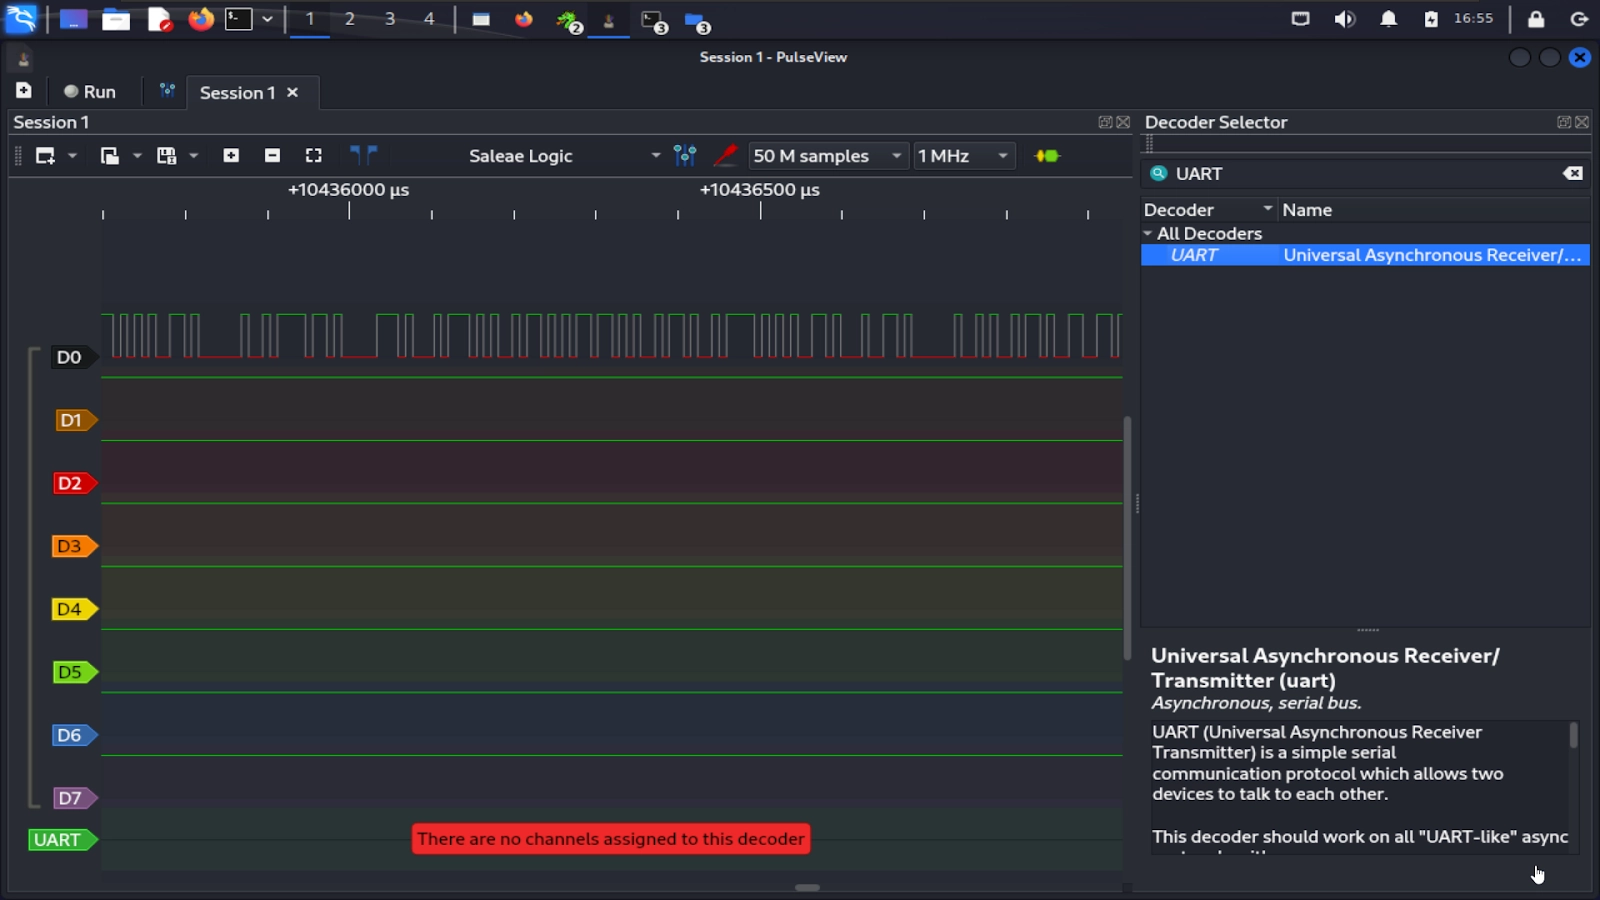
Pulseview can decode the UART capture for us by adding a decoder. To do so, select the yellow and green button beside the “1 MHz” frequency drop-down. This will open the “Decoder Selector.” From there, search for UART and double-click on the UART decoder to add it. It should show up on the bottom.
Additional UART Properties
I like to move the decoder above the channel that I’m using, you can drag and drop it above D0 if you prefer. If you click on the label for the Decoder (UART in this example), you can assign the properties. Select D0 as the “RX (UART receive line)” (leave Tx blank), change “Data format” to ascii, and we’ll leave the rest as the defaults. However, before closing the menu, let’s take this opportunity to quickly learn about some additional UART properties.
Of course we have the Baud rate, for almost all IoT devices this will be 115200. However, some may run at a different rate, the second most common is 9600. There are about a dozen common Baud rates in use, I usually reference this Wikipedia article when I need to look them up. You can measure the Baud rate easily in Pulseview, or just try a brute force method of the most popular ones. That being said, I rarely come across anything that isn’t 115200.
The next parameter is the data bits. This is how many bits of data are being sent in each frame. A frame is the smallest grouping of bits being sent. If you are familiar with networking, it is similar to a packet. This is another setting that is almost always the same value, 8, which makes sense as there are 8 bits in a byte. However, some systems may use fewer such as 7. However, I’ve never seen this on an IoT device.
The next setting is the parity bit. Parity allows for rudimentary error detection by summing the amount of 1s in a frame. This is another setting that I never see on IoT devices, so you can usually safely leave it as “none.”
Finally, we have the stop bits. The stop bit indicates that the frame is done being transmitted after the data bits. In most cases, there is one stop bit that is always a low or “0.” However, some devices need additional timing between frames to decode so they may use additional stop bits. In most IoT devices this will be 1, so it can be left as the default.

Click anywhere outside the decoder to close it. You should now see the ascii decoding showing up above the UART transmission on D0.
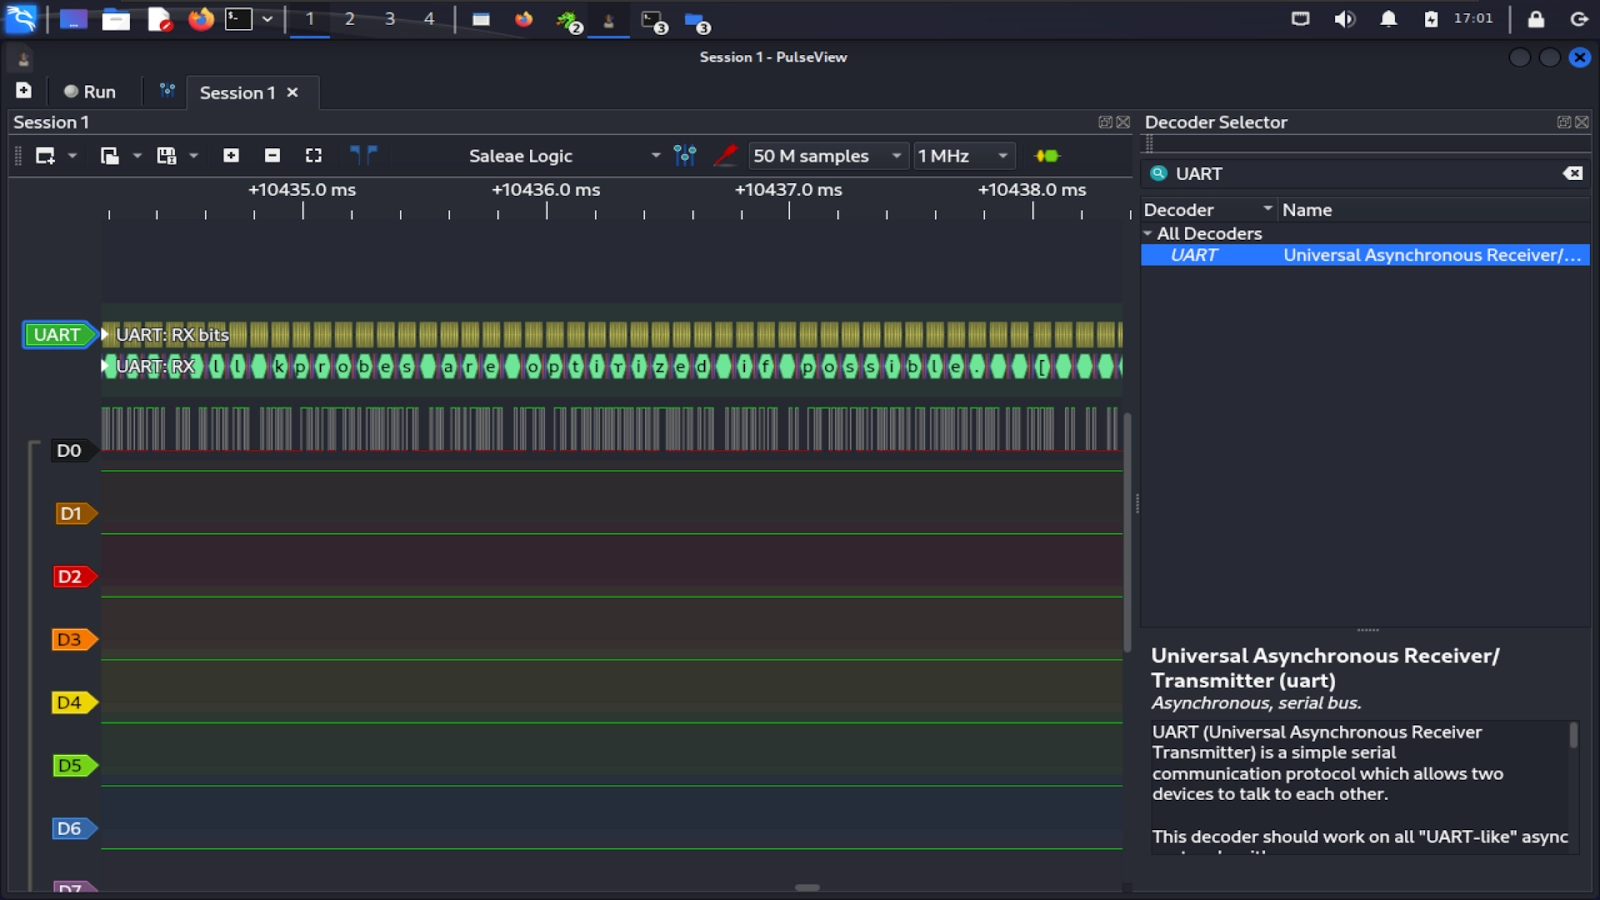
If you scroll through it, you’ll see lots of detailed information about the devices boot up including useful versioning information. We have better tools for reading the UART output, so don’t stress about looking at it all. The purpose of the logic analyzer and this example is to show how to identify protocols, not read all of the output.
Getting a Shell via UART
We’ll now use the USB-UART adapter to get a shell.
First, we’ll connect the adapter to the Raspberry Pi. Note that Rx and Tx lines will be crossed between the adapter and the Pi (this will be the case for any UART device). The Tx from one device transmits to the Rx on the other device and vice versa. The ground connections are wired together.
The connections are as follows:
Pi Ground -> USB-UART Adapter Ground (Black Wire)
Pi Tx -> USB-UART Adapter Rx (White Wire)
Pi Rx -> USB-UART Adapter Tx (Blue Wire)
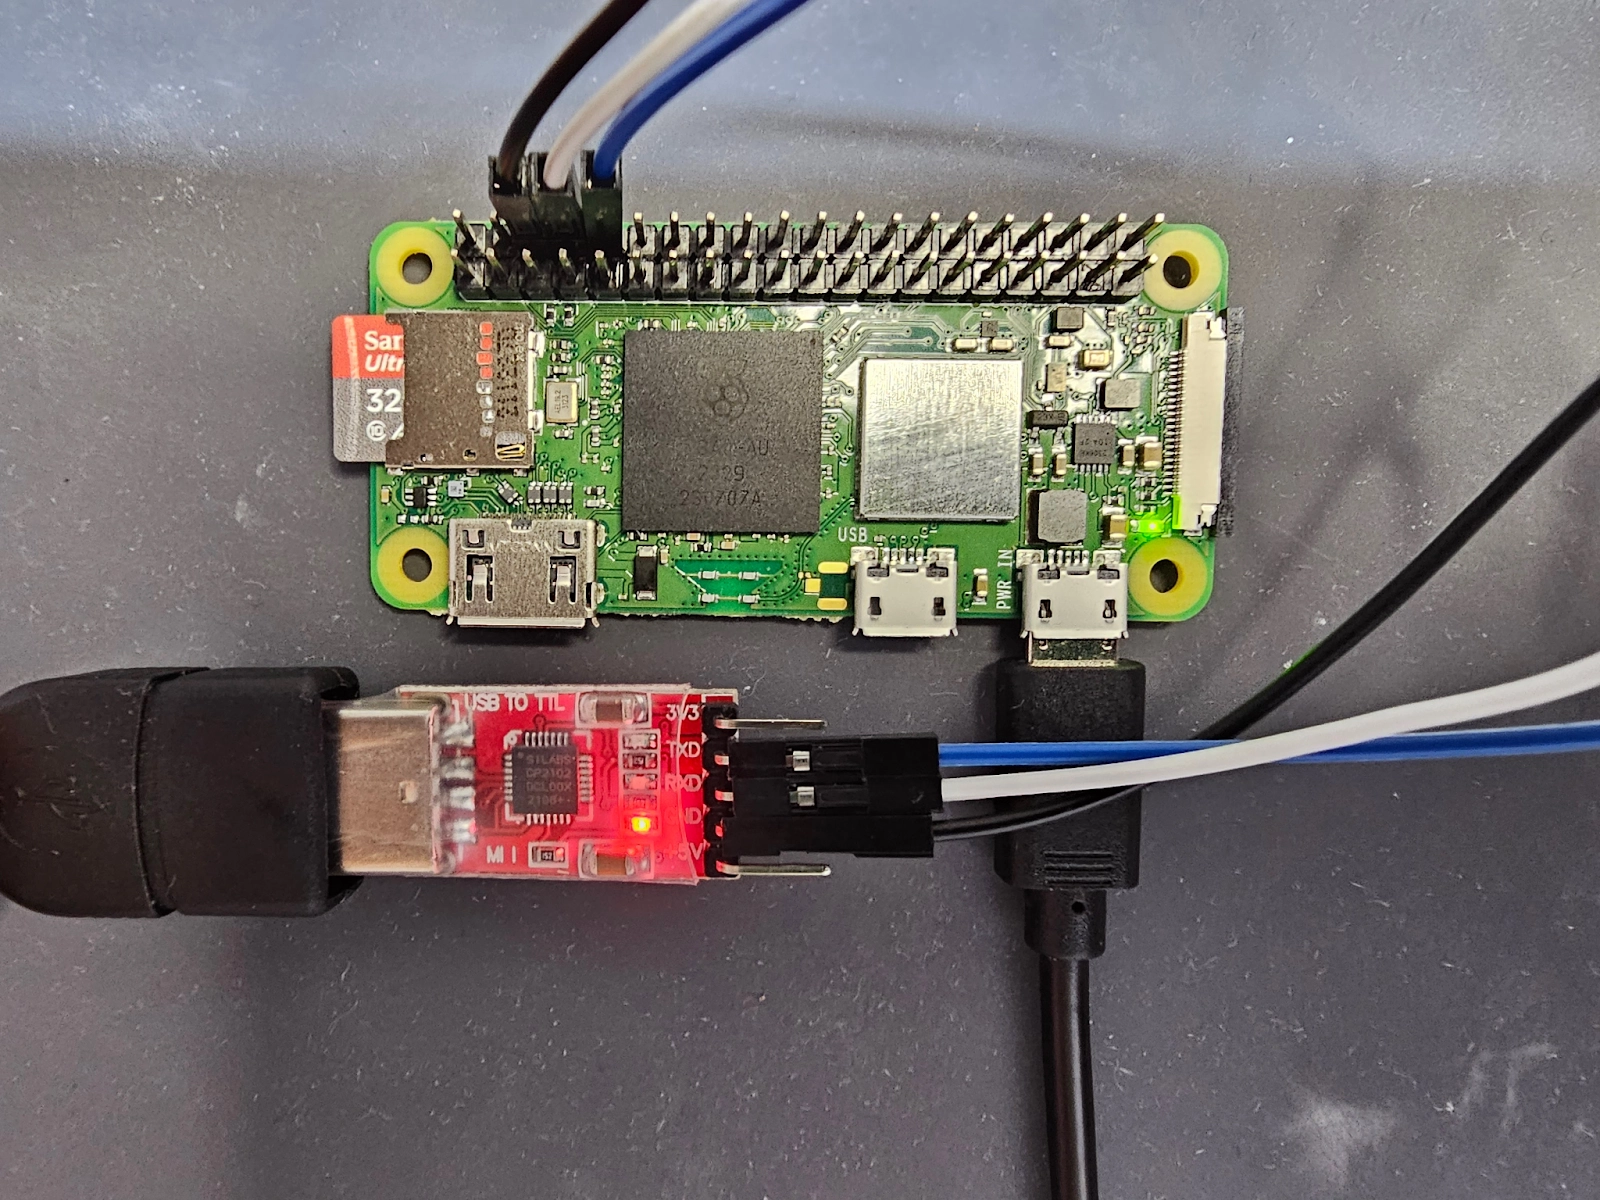
You can now plug the adapter into your computer if you haven’t already. If you’re using a VM, don’t forget to connect the removable device. It will show up as “Silicon CP2102 USB to UART bridge controller.”
To ensure it’s connected and to see what tty device number it has, run the following command in the terminal.
sudo dmesg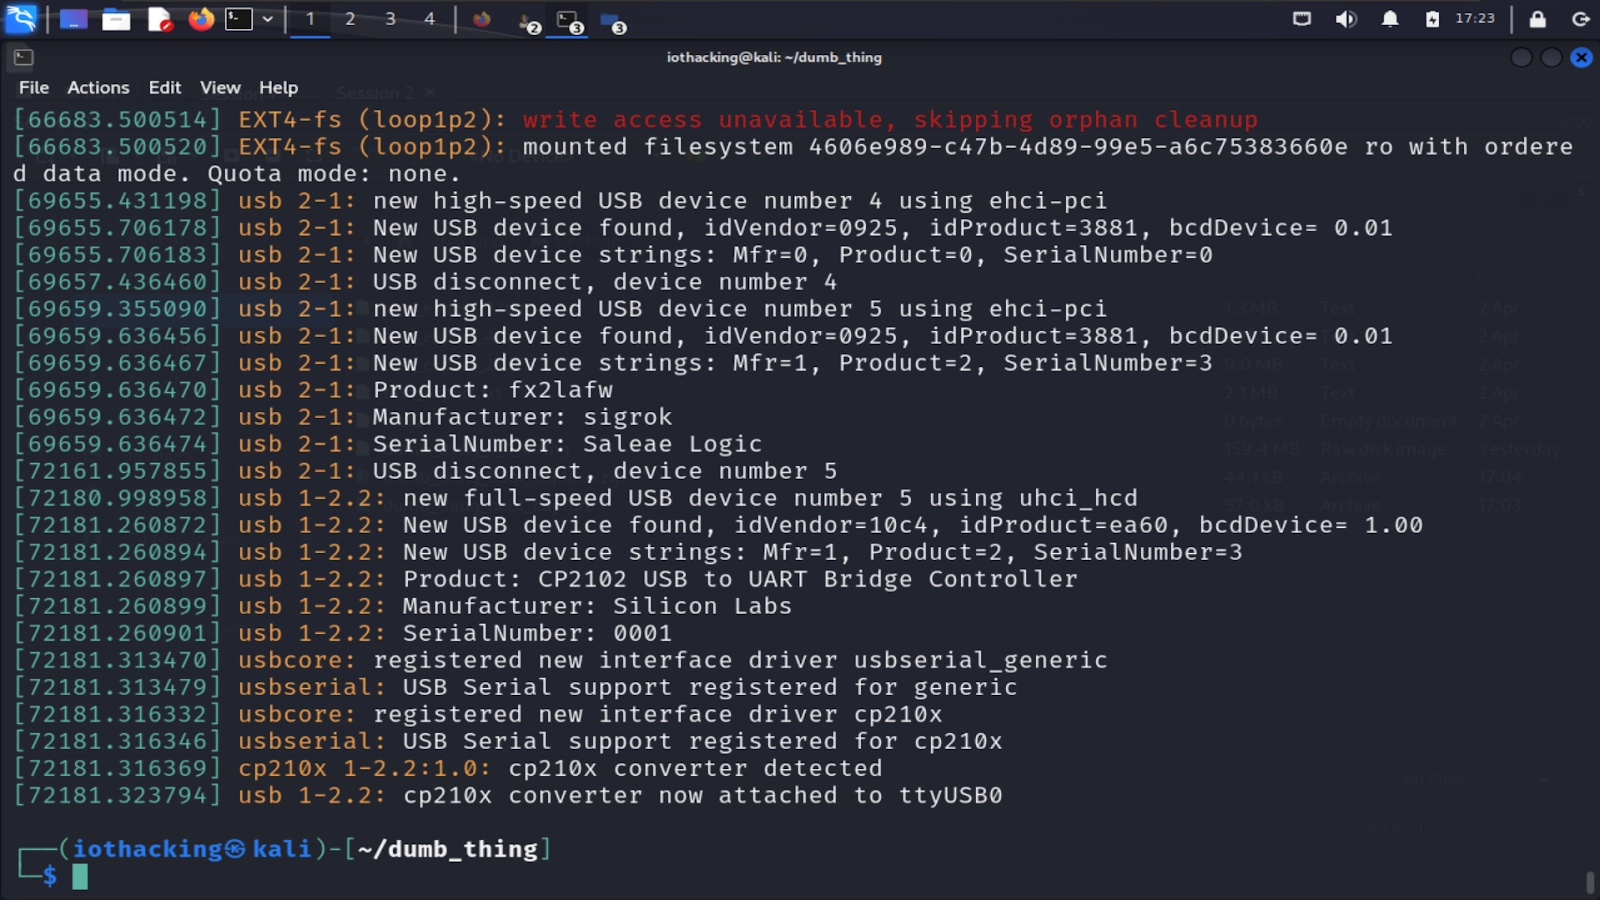
We’ll be using screen as our terminal emulator for this lesson. You can initiate a UART shell with screen with the following command:
sudo screen /dev/ttyUSB0 115200Note that you may need to replace ttyUSB0 with a different number depending on what yours showed when running dmesg. Also, unless you’re running as root or added your user to the dialout group you’ll need to use sudo to interact with ttyUSB devices. Finally, take note of the last argument which is the baud rate, in our case it’s the standard 115200.
After screen is running, power on the Raspberry Pi. It will take a few seconds before it begins to output to UART. Once it does, you’ll see a stream of data coming through showing the boot logs. If this is your first time running the supplied firmware, you’ll notice the device hangs when trying to setup dhcp (around 30 seconds). This is because we still need to configure WiFi.
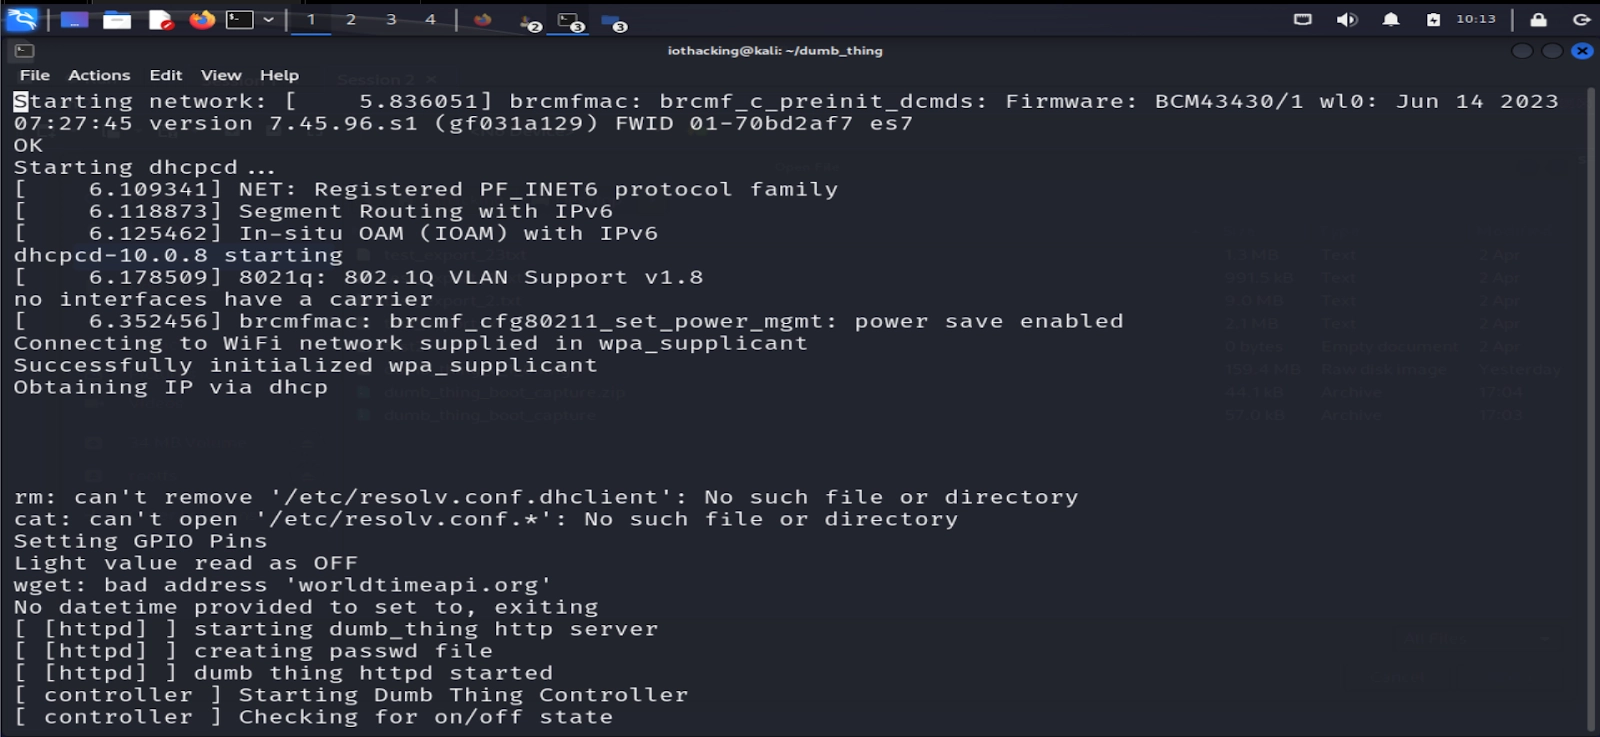
You may notice in screen that you can’t scroll up and down. In order to scroll up or down and copy any data, you’ll need to enter copy mode. You can do this by pressing the control key, a key and [ key all together at once (ctrl + a + [). This will pause any new messages being displayed, but allow you to scroll freely using up and down arrows or page up and down. To exit copy mode, hit escape or enter, and to exit screen press control, a and k all together (ctrl + a + k)
Once the device is finished booting, you’ll be greeted with a “Welcome to Dumb Thing” banner and should see “root login:” If you don’t see this, pressing enter should bring up the login prompt.
The login credentials are:
User: root
Password: tcm
We will configure WiFi for the last part of the setup by editing the wpa_supplicant.conf file.
To do so we’ll make use of vi.
vi /etc/wpa_supplicant.confOnce in vi, press the “i” key to enter interactive mode. This is what will allow you to erase and type. Edit the supplicant to put your wireless SSID and PSK (PSK=Pre Shared Key which is your WiFi password) inside of the quotes where there is your_ssid_here and your_psk_here.
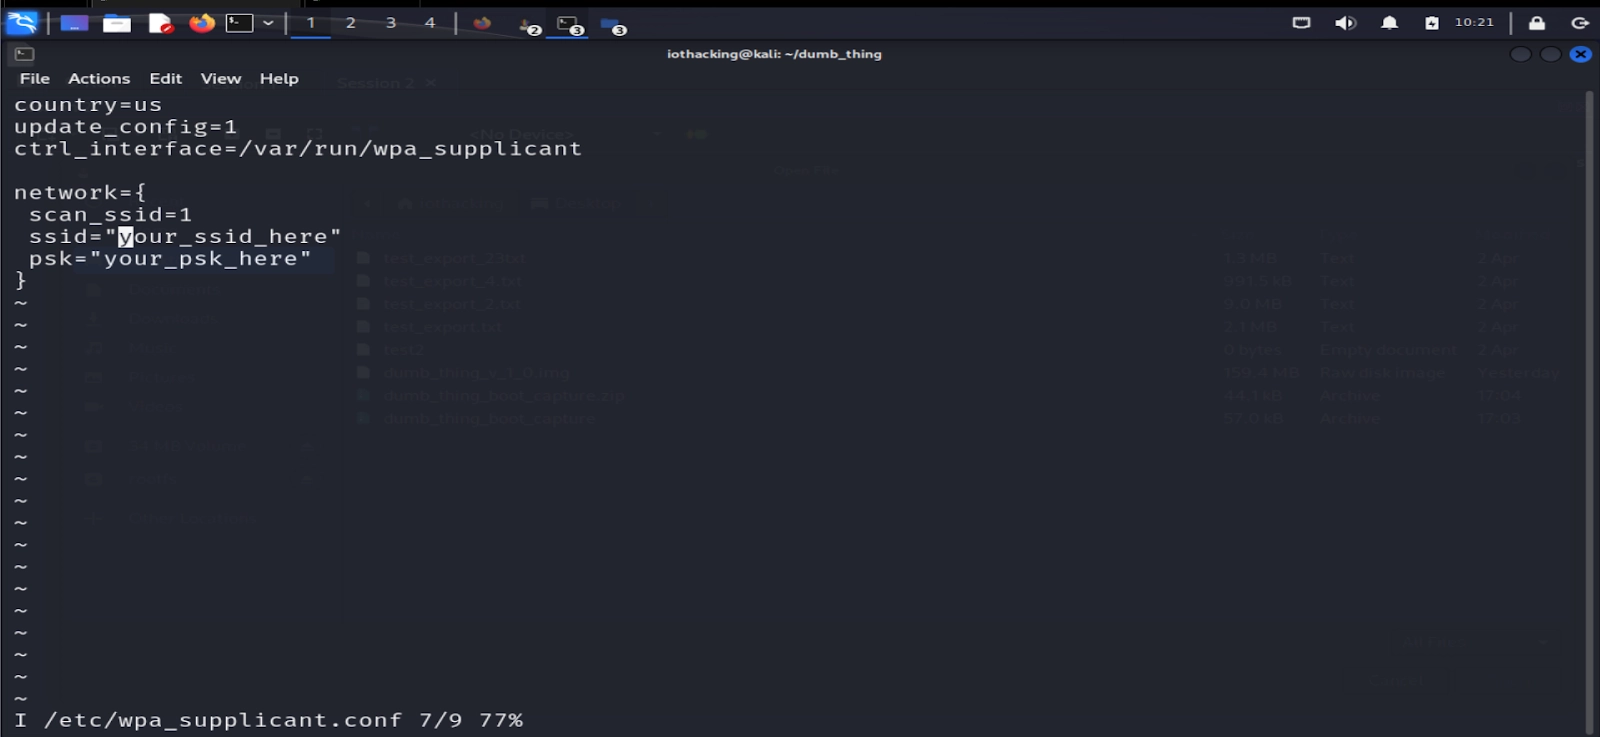
To save the file, press the “esc” key to exit interactive mode. Then press the “:” key, and type “wq” for save and quit and press the “enter” key. You can do a quick check on the file by running:
cat /etc/wpa_supplicant.confAnd making sure it properly saved your WiFi details.
Note that because of the nature of how UART shells work, you may have your shell even when in vi interrupted by logging messages, see the example below. These are only displayed and don’t affect what you’re typing. If this happens while in vi, you can safely ignore any of the logging messages.
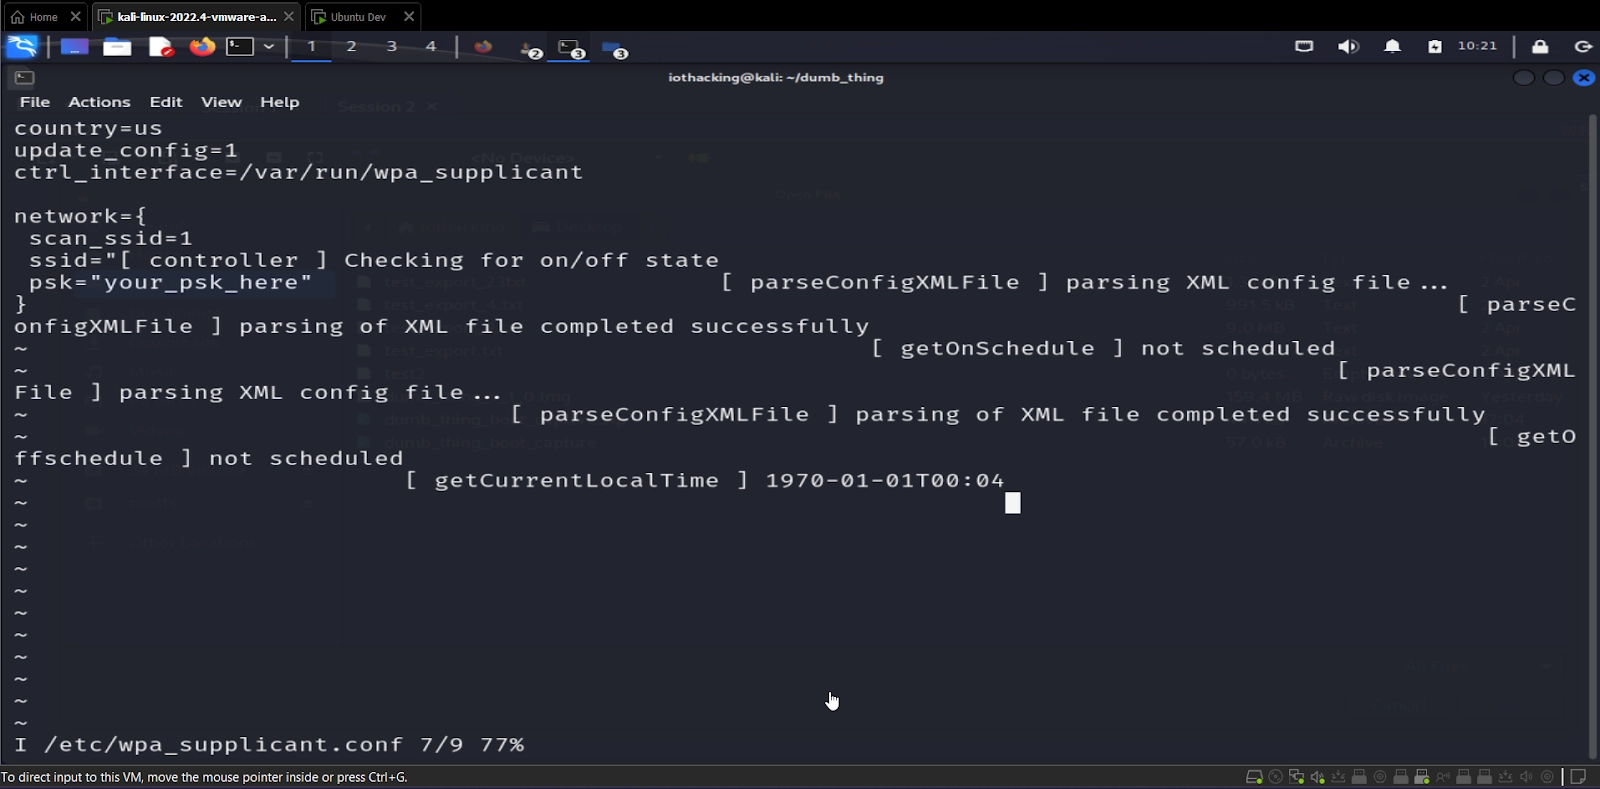
Keep in mind that your WiFi details are now saved on the SD card in this file, you may want to erase it when you’re done using it!
This is unfortunately the case for many consumer IoT devices, and is a good reason to make sure you factory reset any IoT devices before disposing of them.
With the WiFi configured, you can now reboot the Pi either by unplugging it and plugging it back in, or by using the reboot command. Once rebooted and you’ve logged in, you can check that the WiFi is working by running ifconfig and ensuring you have an IP address on your wireless network subnet.
Congrats you’ve now set up your Pi and have a UART shell. At this point, you can begin enumerating the Pi via the UART shell. We’ll pick up in the next blog post in this series by using the UART shell to hunt for files of interest and view log messages that we prompt by interacting with the device.

About the Author: Andrew Bellini
My name is Andrew Bellini and I sometimes go as DigitalAndrew on social media. I’m an electrical engineer by trade with a bachelor’s degree in electrical engineering and am a licensed Professional Engineer (P. Eng) in Ontario, Canada. While my background and the majority of my career has been in electrical engineering, I am also an avid and passionate ethical hacker.
I am the instructor of our Beginner’s Guide to IoT and Hardware Hacking course and I also created the Practical IoT Pentest Associate (PIPA) certification.
In addition to my love for all things ethical hacking, cybersecurity, CTFs and tech I also am a dad, play guitar and am passionate about the outdoors and fishing.
About TCM Security
TCM Security is a veteran-owned, cybersecurity services and education company founded in Charlotte, NC. Our services division has the mission of protecting people, sensitive data, and systems. With decades of combined experience, thousands of hours of practice, and core values from our time in service, we use our skill set to secure your environment. The TCM Security Academy is an educational platform dedicated to providing affordable, top-notch cybersecurity training to our individual students and corporate clients including both self-paced and instructor-led online courses as well as custom training solutions. We also provide several vendor-agnostic, practical hands-on certification exams to ensure proven job-ready skills to prospective employers.
Pentest Services: https://tcmdev.tcmsecurity.com/our-services/
Follow Us: Blog | LinkedIn | YouTube | Twitter | Facebook | Instagram
Contact Us: sales@tcm-sec.com
See How We Can Secure Your Assets
Let’s talk about how TCM Security can solve your cybersecurity needs. Give us a call, send us an e-mail, or fill out the contact form below to get started.

